WeWork Results Presentation Deck
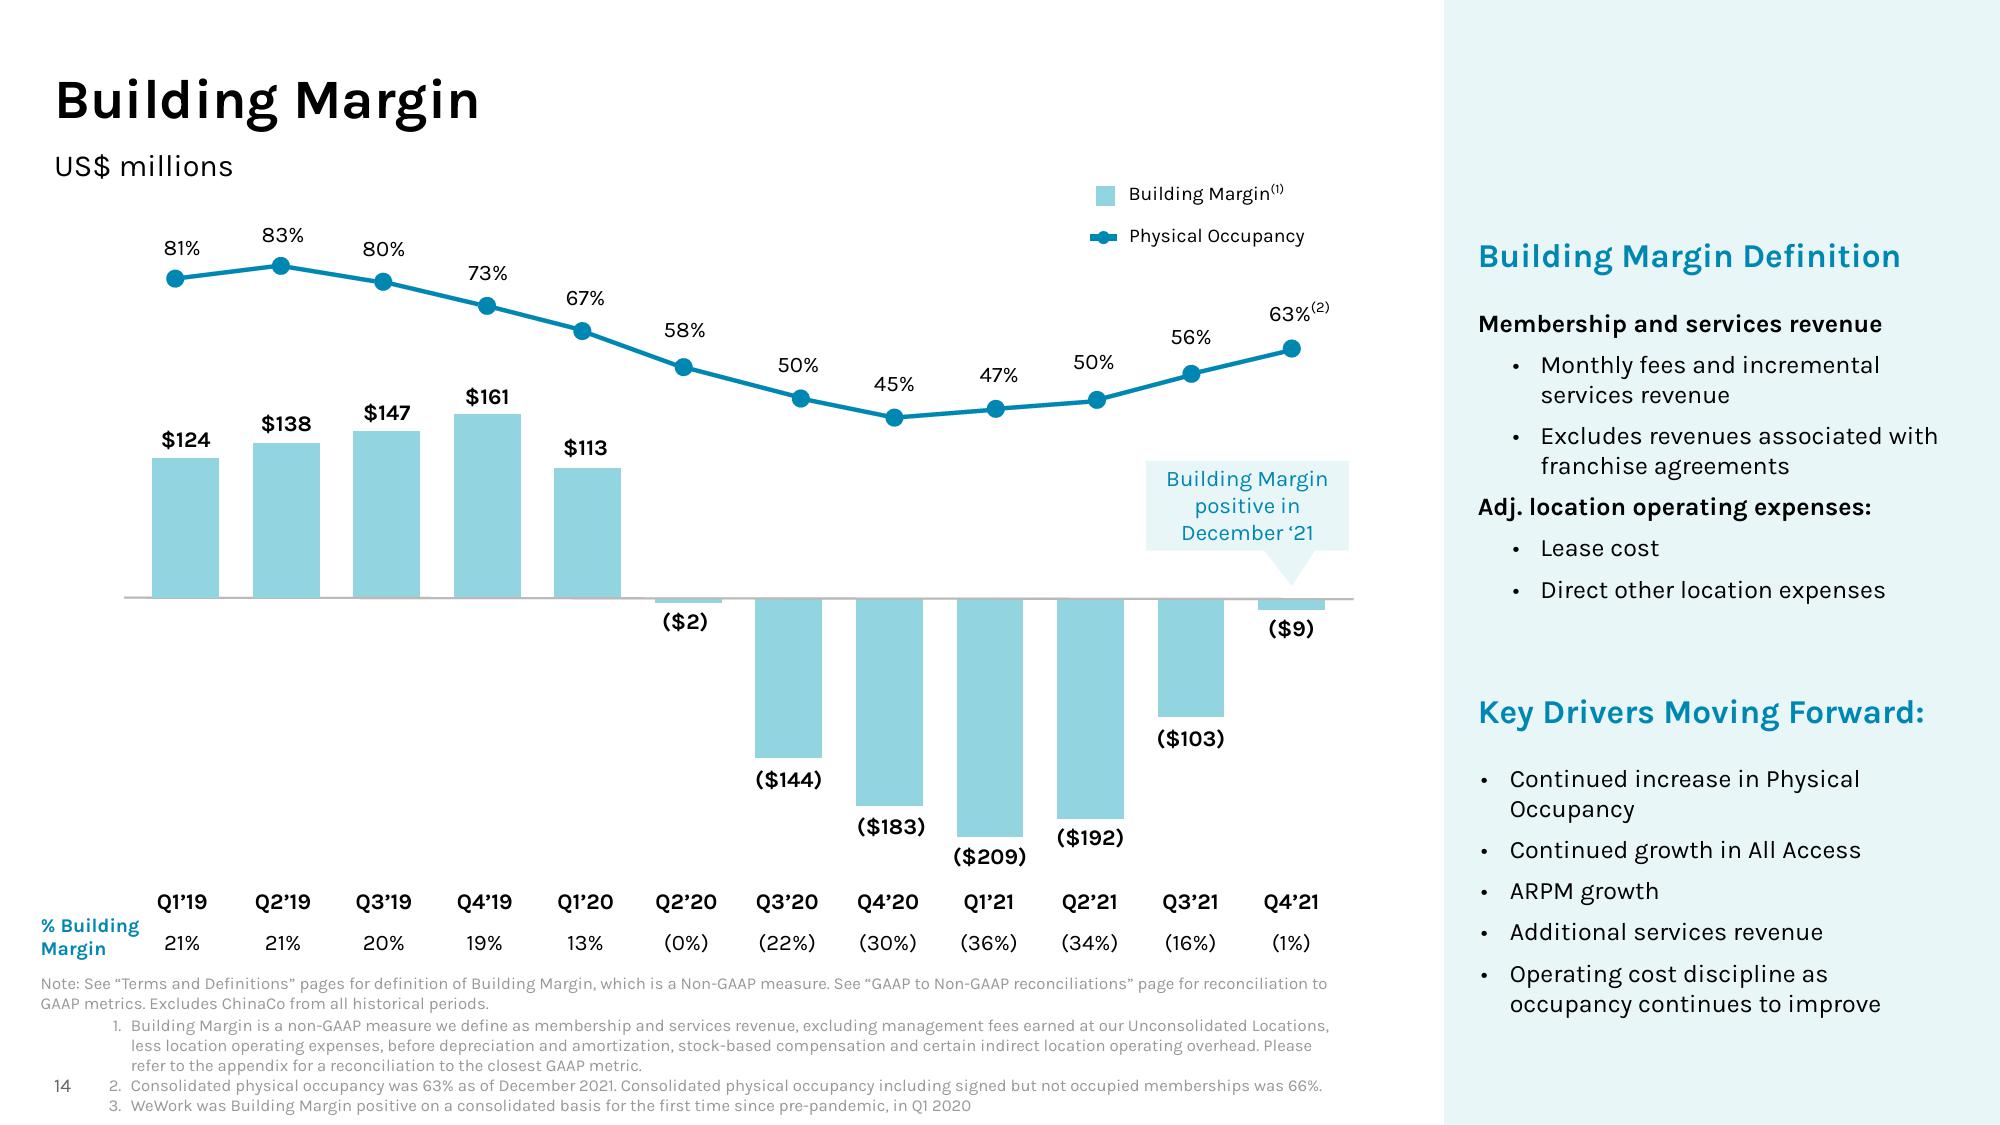
Building Margin
US$ millions
% Building
Margin
81%
14
$124
Q1'19
21%
83%
$138
80%
$147
73%
$161
Q2'19 Q3'19 Q4'19
21%
20%
19%
67%
$113
Q1'20
13%
58%
($2)
Q2'20
(0%)
50%
($144)
45%
($183)
47%
50%
($192)
Building Margin(¹)
Physical Occupancy
56%
Building Margin
positive in
December ¹21
($103)
63% (2)
($209)
Q3'20 Q4'20
Q1'21 Q2'21 Q3'21
(22%) (30%) (36%) (34%) (16%)
($9)
Q4'21
(1%)
Note: See "Terms and Definitions" pages for definition of Building Margin, which is a Non-GAAP measure. See "GAAP to Non-GAAP reconciliations" page for reconciliation to
GAAP metrics. Excludes ChinaCo from all historical periods.
1. Building Margin is a non-GAAP measure we define as membership and services revenue, excluding management fees earned at our Unconsolidated Locations,
less location operating expenses, before depreciation and amortization, stock-based compensation and certain indirect location operating overhead. Please
refer to the appendix for a reconciliation to the closest GAAP metric.
2. Consolidated physical occupancy was 63% as of December 2021. Consolidated physical occupancy including signed but not occupied memberships was 66%.
3. WeWork was Building Margin positive on a consolidated basis for the first time since pre-pandemic, in Q1 2020
Building Margin Definition
Membership and services revenue
Monthly fees and incremental
services revenue
●
• Excludes revenues associated with
franchise agreements
Adj. location operating expenses:
Lease cost
• Direct other location expenses
●
.
Key Drivers Moving Forward:
Continued increase in Physical
Occupancy
Continued growth in All Access
• ARPM growth
. Additional services revenue
Operating cost discipline as
occupancy continues to improveView entire presentation