Maersk Results Presentation Deck
Maersk Group
- Interim Report 03 2015
instalments, offset by the sale of one product vessel, while 03
2014 was positively impacted by the divestment of the VLCC
segment.
Maersk Tankers signed a newbuilding contract for nine MR
vessels with a contract value of approximately USD 300m in
September. The order book totals 17 MR newbuildings to be
added to the fleet over the next three years, as part of the fleet
renewal.
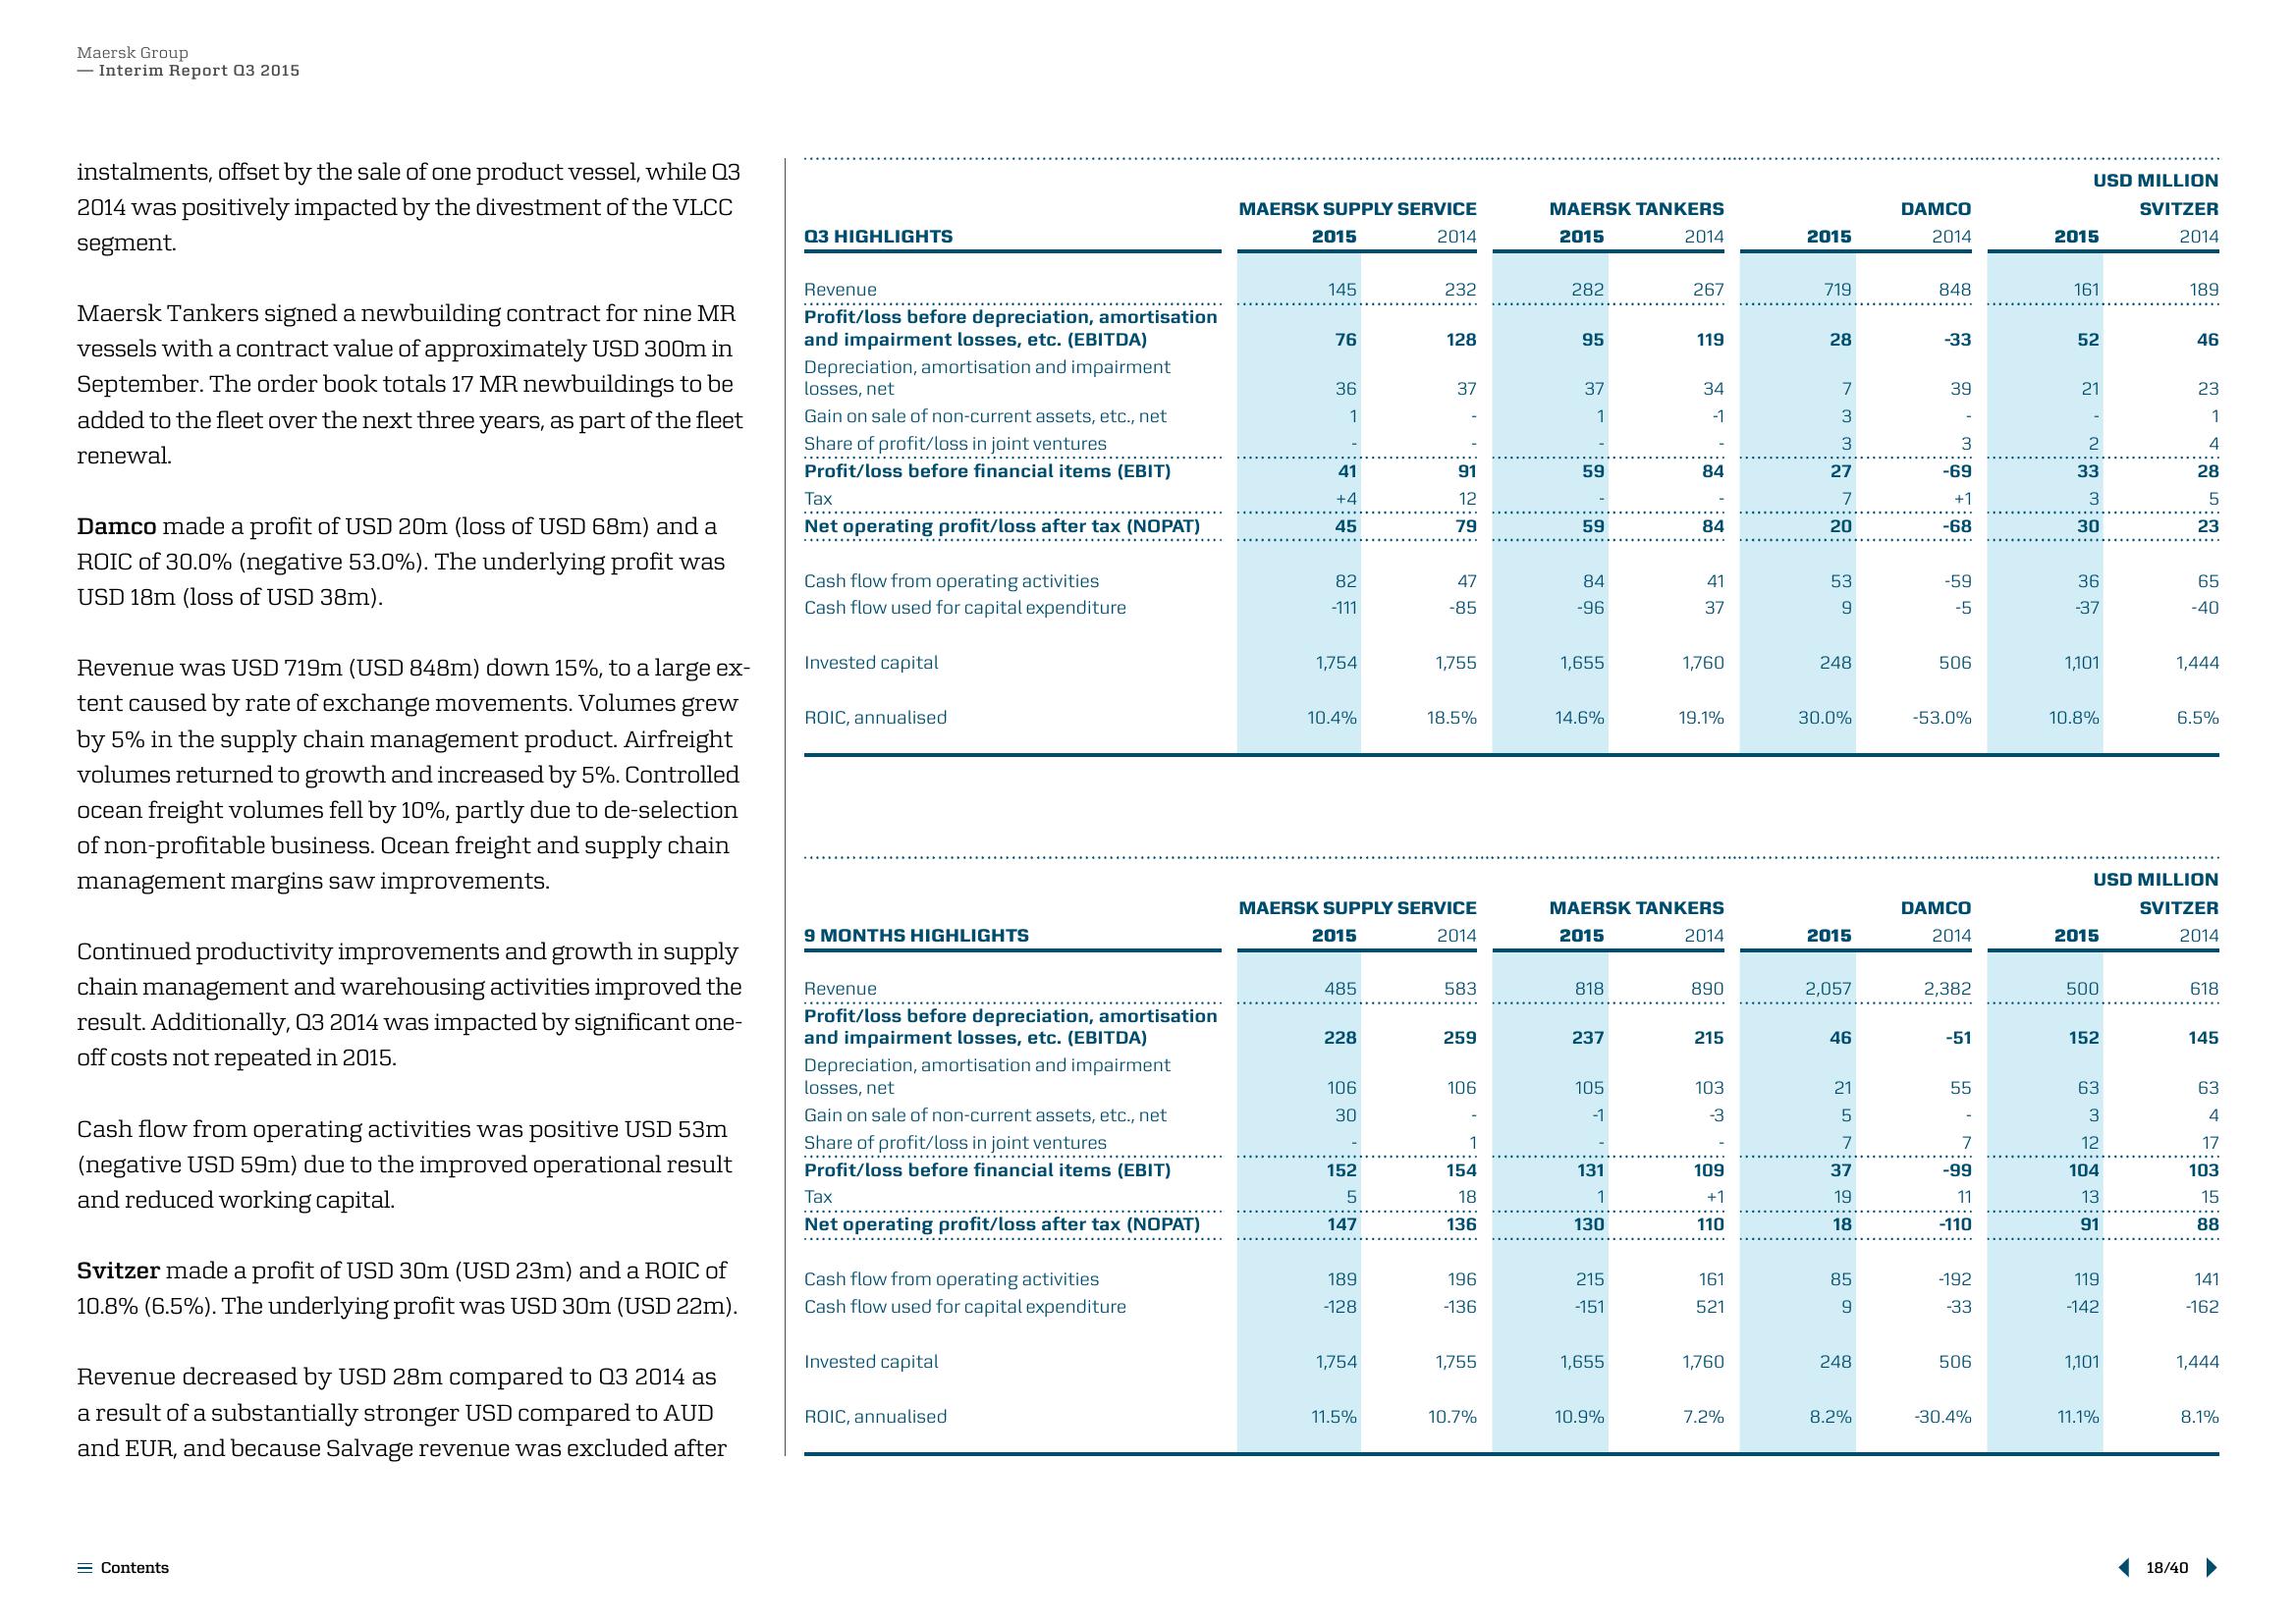
Damco made a profit of USD 20m (loss of USD 68m) and a
ROIC of 30.0% (negative 53.0%). The underlying profit was
USD 18m (loss of USD 38m).
Revenue was USD 719m (USD 848m) down 15%, to a large ex-
tent caused by rate of exchange movements. Volumes grew
by 5% in the supply chain management product. Airfreight
volumes returned to growth and increased by 5%. Controlled
ocean freight volumes fell by 10%, partly due to de-selection
of non-profitable business. Ocean freight and supply chain
management margins saw improvements.
Continued productivity improvements and growth in supply
chain management and warehousing activities improved the
result. Additionally, Q3 2014 was impacted by significant one-
off costs not repeated in 2015.
Cash flow from operating activities was positive USD 53m
(negative USD 59m) due to the improved operational result
and reduced working capital.
Svitzer made a profit of USD 30m (USD 23m) and a ROIC of
10.8% (6.5%). The underlying profit was USD 30m (USD 22m).
Revenue decreased by USD 28m compared to 03 2014 as
a result of a substantially stronger USD compared to AUD
and EUR, and because Salvage revenue was excluded after
Contents
Q3 HIGHLIGHTS
Revenue
Profit/loss before depreciation, amortisation
and impairment losses, etc. (EBITDA)
Depreciation, amortisation and impairment
losses, net
Gain on sale of non-current assets, etc., net
Share of profit/loss in joint ventures
**********
Profit/loss before financial items (EBIT)
Tax
Net operating profit/loss after tax (NOPAT)
Cash flow from operating activities
Cash flow used for capital expenditure
Invested capital
ROIC, annualised
9 MONTHS HIGHLIGHTS
Revenue
.……….….....
Profit/loss before depreciation, amortisation
and impairment losses, etc. (EBITDA)
Depreciation, amortisation and impairment
losses, net
Gain on sale of non-current assets, etc., net
Share of profit/loss in joint ventures
Profit/loss before financial items (EBIT)
.…………………..…….
Tax
Net operating profit/loss after tax (NOPAT)
Cash flow from operating activities
Cash flow used for capital expenditure
Invested capital
ROIC, annualised
MAERSK SUPPLY SERVICE
2015
2014
145
76
36
1
41
+4
45
82
-111
1,754
10.4%
485
228
106
30
152
5
147
189
-128
1,754
232
MAERSK SUPPLY SERVICE
2015
2014
11.5%
128
37
91
12
79
47
-85
1,755
18.5%
583
259
106
1
154
18
136
196
-136
1,755
10.7%
MAERSK TANKERS
2015
2014
282
95
37
1
59
59
84
-96
1,655
14.6%
818
237
105
-1
131
1
130
215
-151
1,655
267
MAERSK TANKERS
2015
2014
10.9%
119
34
-1
84
84
41
37
1,760
19.1%
890
215
103
-3
109
+1
110
161
521
1,760
7.2%
2015
719
28
7
3
3
27
7
20
53
9
248
30.0%
2015
2,057
46
21
5
7
37
19
18
85
9
248
8.2%
DAMCO
2014
848
-33
39
3
-69
+1
-68
-59
-5
506
-53.0%
DAMCO
2014
2,382
-51
55
7
-99
11
-110
-192
-33
506
-30.4%
USD MILLION
SVITZER
2014
2015
161
52
21
2
33
3
30
36
-37
1,101
10.8%
2015
500
152
63
3
12
USD MILLION
SVITZER
2014
104
13
91
119
-142
1,101
11.1%
189
46
23
1
4
28
5
23
65
-40
1,444
6.5%
18/40
618
145
63
4
17
103
15
88
141
-162
1,444
8.1%View entire presentation