Paysafe Results Presentation Deck
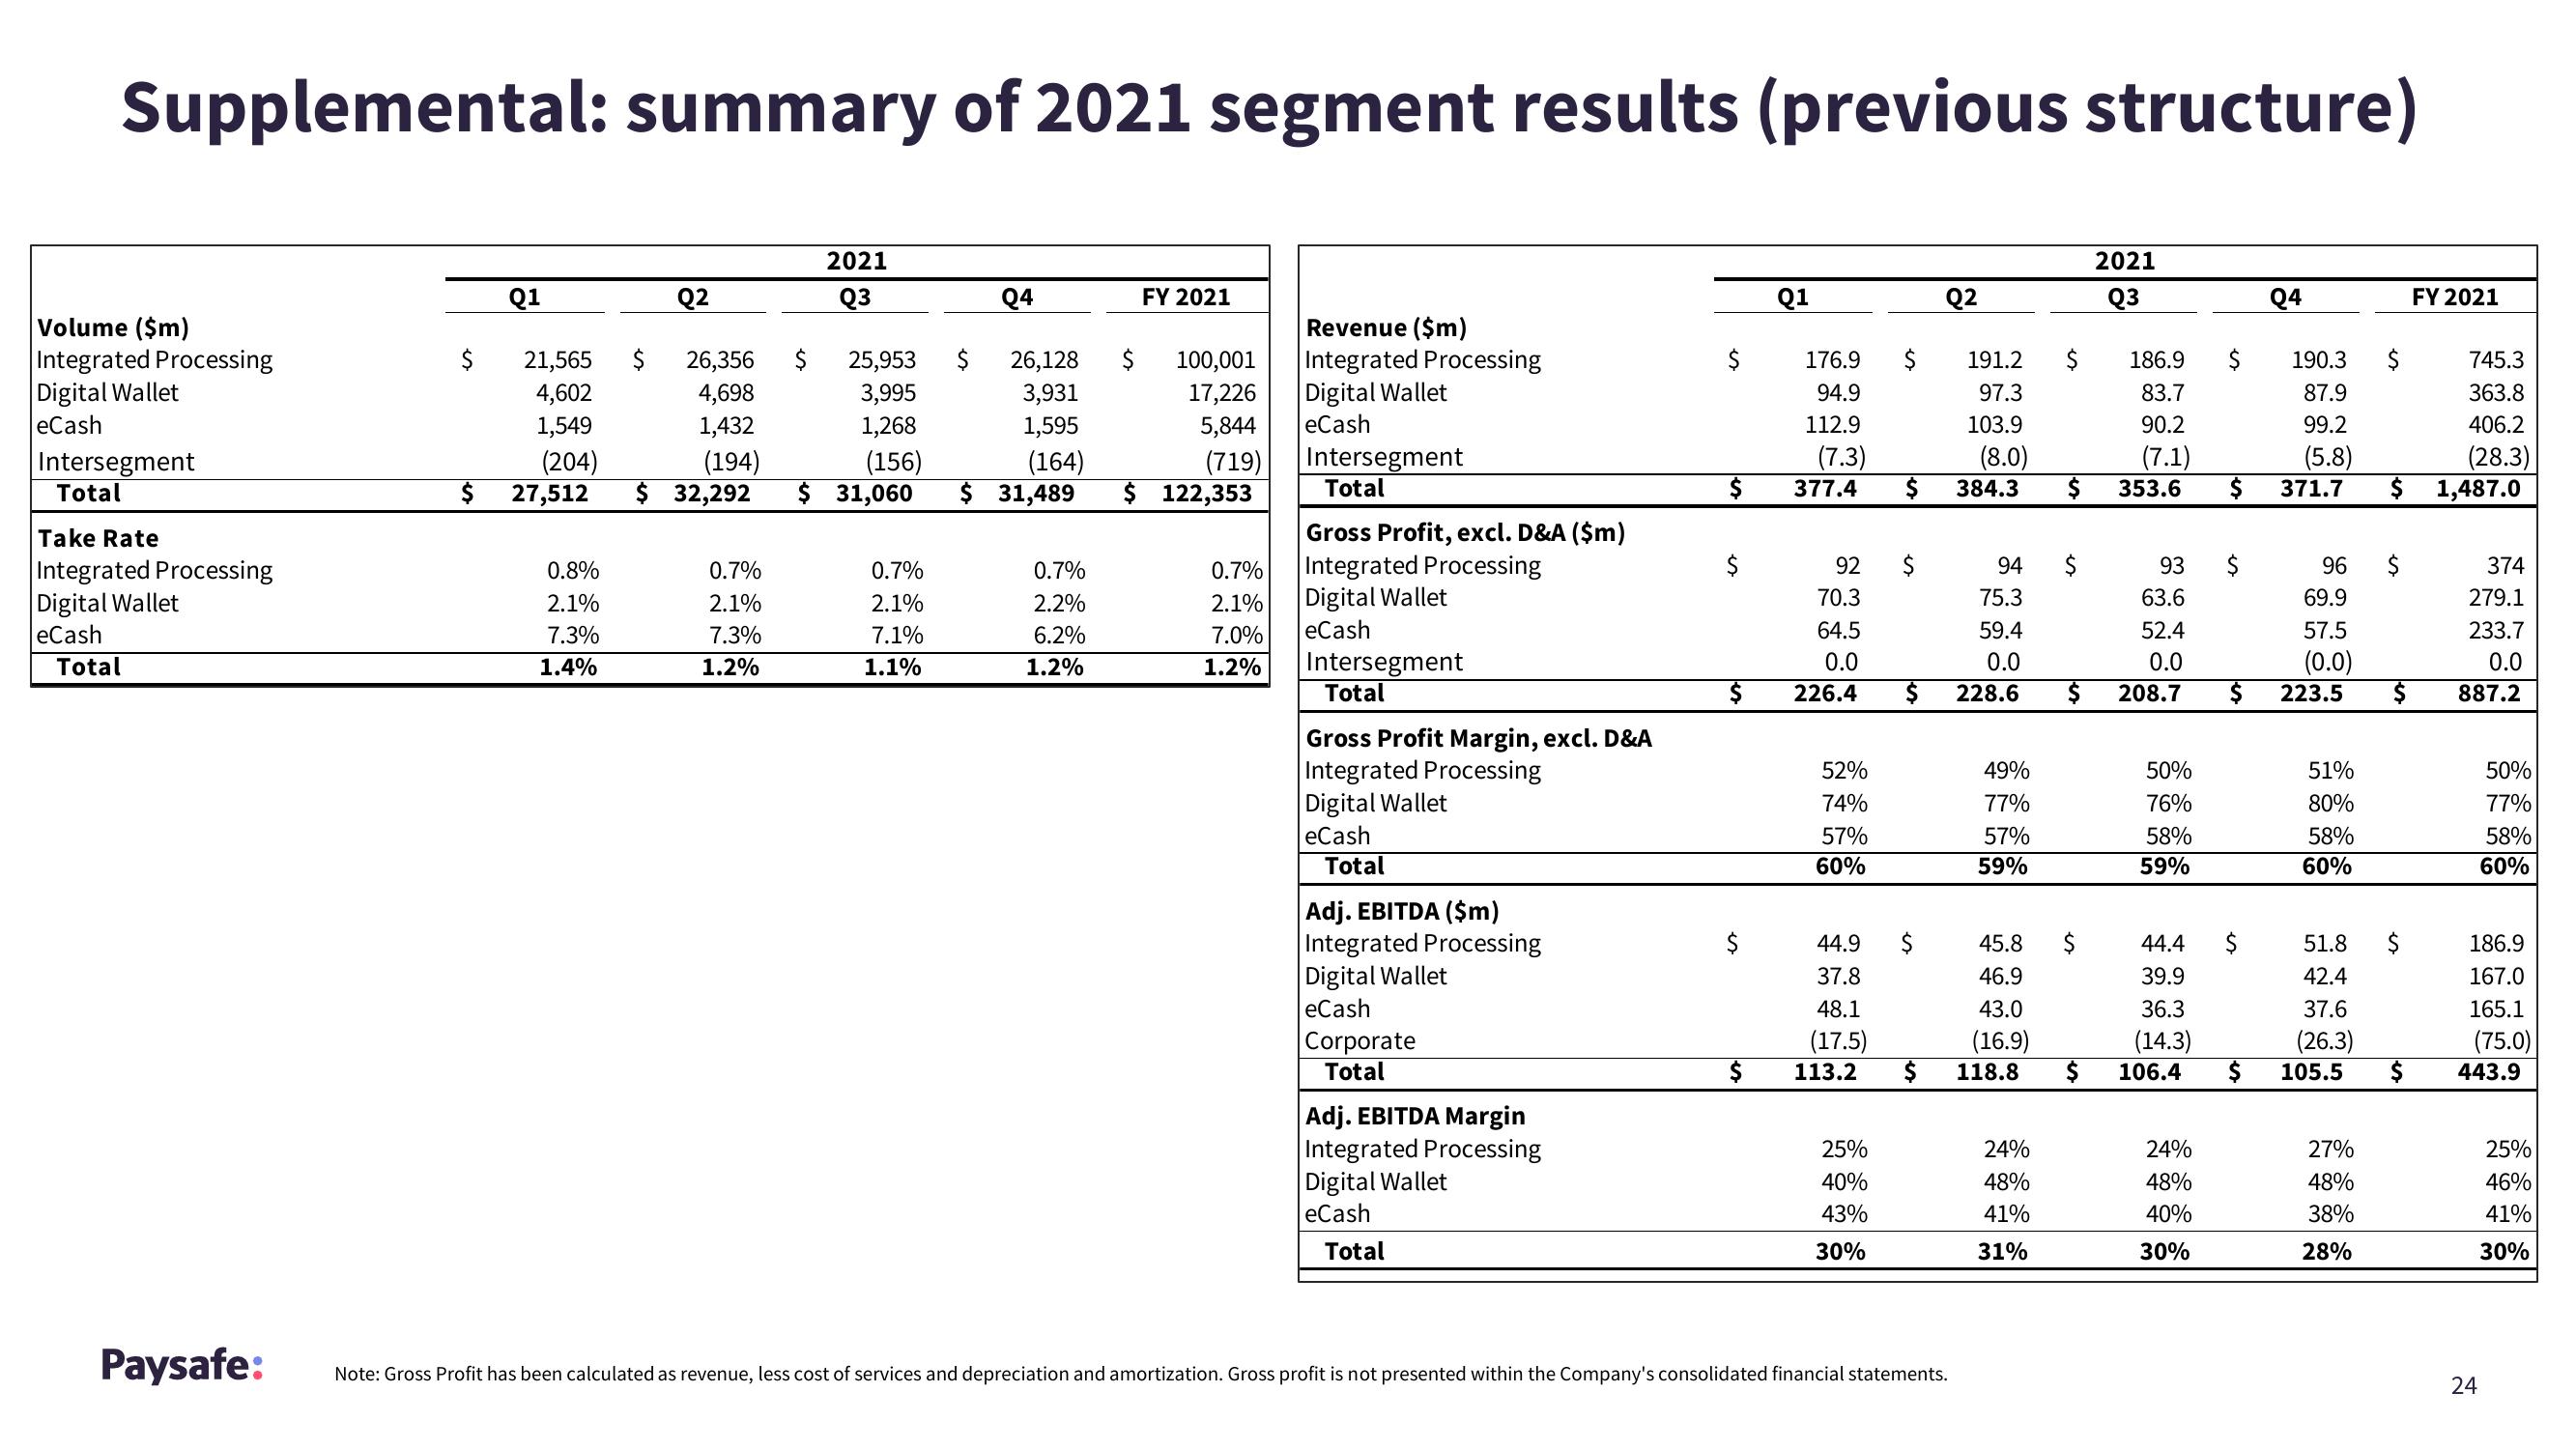
Supplemental: summary of 2021 segment results (previous structure)
Volume ($m)
Integrated Processing
Digital Wallet
eCash
Intersegment
Total
Take Rate
Integrated Processing
Digital Wallet
eCash
Total
Paysafe:
Q1
Q2
0.8%
2.1%
7.3%
1.4%
21,565 $ 26,356
25,953
3,995
26,128
3,931
4,602
4,698
1,549
1,432
1,268
1,595
(204)
(194)
(156)
(164)
$ 27,512
$ 32,292 $ 31,060 $ 31,489
0.7%
2.1%
7.3%
1.2%
2021
૨૩
$
0.7%
2.1%
7.1%
1.1%
Q4
$
0.7%
2.2%
6.2%
1.2%
FY 2021
100,001
17,226
5,844
(719)
$ 122,353
Revenue ($m)
Integrated Processing
Digital Wallet
eCash
Intersegment
Total
Gross Profit, excl. D&A ($m)
Integrated Processing
0.7%
2.1%
7.0% eCash
1.2%
Digital Wallet
Intersegment
Total
Gross Profit Margin, excl. D&A
Integrated Processing
Digital Wallet
eCash
Total
Adj. EBITDA ($m)
Integrated Processing
Digital Wallet
eCash
Corporate
Total
Adj. EBITDA Margin
Integrated Processing
Digital Wallet
eCash
Total
$
$
$
$
Q1
176.9
94.9
112.9
(7.3)
377.4
64.5
0.0
226.4
92 $
70.3
52%
74%
57%
60%
44.9
37.8
48.1
(17.5)
$ 113.2
$
25%
40%
43%
30%
191.2
97.3
103.9
(8.0)
$ 384.3
Q2
$
94 $
75.3
59.4
0.0
$ 228.6
Note: Gross Profit has been calculated as revenue, less cost of services and depreciation and amortization. Gross profit is not presented within the Company's consolidated financial statements.
49%
77%
57%
59%
$ 186.9
83.7
90.2
(7.1)
353.6 $
$
24%
48%
41%
31%
$
45.8
46.9
43.0
(16.9)
118.8 $
2021
Q3
93
63.6
52.4
0.0
208.7
50%
76%
58%
59%
44.4
39.9
36.3
(14.3)
106.4
24%
48%
40%
30%
$
$
Q4
96
69.9
57.5
(0.0)
$ 223.5
$
190.3
87.9
99.2
(5.8)
371.7
51%
80%
58%
60%
$
27%
48%
38%
28%
745.3
363.8
406.2
(28.3)
$ 1,487.0
$
$
51.8
42.4
37.6
(26.3)
105.5 $
FY 2021
374
279.1
233.7
0.0
887.2
50%
77%
58%
60%
186.9
167.0
165.1
(75.0)
443.9
24
25%
46%
41%
30%View entire presentation