Evercore Investment Banking Pitch Book
Appendix
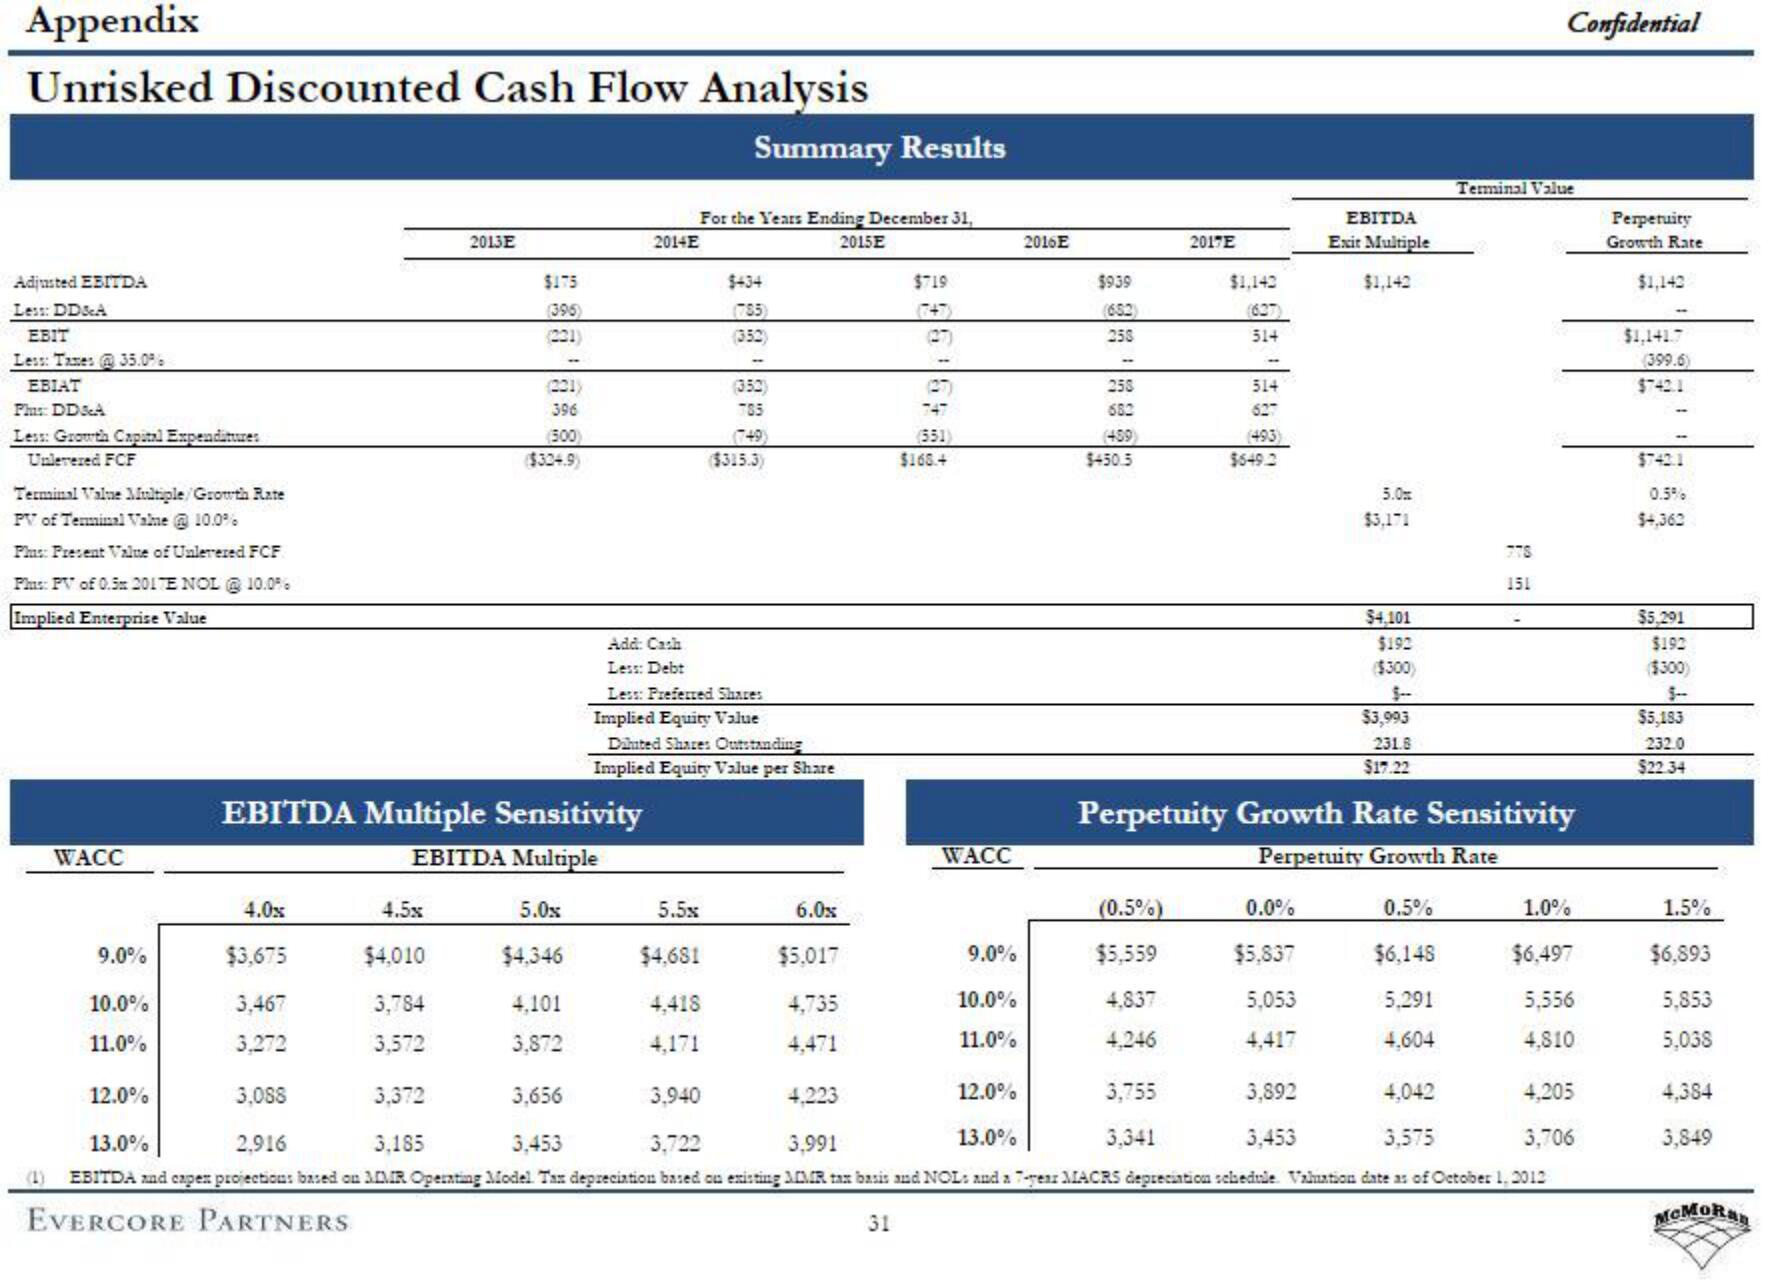
Unrisked Discounted Cash Flow Analysis
Adjusted EBITDA
Less: DD&A
EBIT
Less: Taxes @ 35.0%
EBIAT
Plus: DD&A
Less: Growth Capital Expenditures
Unlevered FCF
Terminal Value Multiple/Growth Rate
PV of Terminal Valme @ 10.0%
Plus: Present Value of Unlerered FCF
Plus: PV of 0.5 2017E NOL @ 10.0%
Implied Enterprise Value
WACC
9.0%
10.0%
11.0%
12.0%
4.0x
$3.675
3,467
3,272
4.5x
2013E
$4,010
3,784
3,572
$175
(396)
(221)
396
(500)
($324.9)
EBITDA Multiple Sensitivity
EBITDA Multiple
5.0x
$4,346
4,101
3,872
2014E
Summary Results
For the Years Ending December 31,
2015E
$434
(785)
(352)
5.5x
$4,681
4,418
4,171
(352)
785
Add: Cach
Less: Debt
Less: Preferred Shares
Implied Equity Value
($315.3)
Dihted Share: Outstanding
Implied Equity Value per Share
6.0x
$5.017
4,735
4,471
$719
(551)
$168.4
WACC
9.0%
10.0%
11.0%
2016E
$939
(652)
258
258
682
(459)
$450.5
(0.5%)
$5,559
4,837
4,246
2017E
3,755
3,341
$1,142
(637)
314
514
627
(493)
$649.2
EBITDA
Exit Multiple
0.0%
$5,837
5,053
4,417
$1,142
5.0
$3,171
$4,101
$192
($300)
$3,993
231.8
$17.22
Perpetuity Growth Rate Sensitivity
Perpetuity Growth Rate
0.5%
$6,148
5,291
4.604
Confidential
Terminal Value
3TS
151
1.0%
$6,497
5.556
4,810
3,088
3,372
3,656
3,940
4,223
12.0%
3,892
4,042
4,205
2,916
3,185
3.453
3,722
3,991
13.0%
3,453
3,575
3,706
13.0%
EBITDA and capen projections based on MMR Operating Model Tax depreciation based on existing MMR tax basis and NOL: and a 7-year MACRS depreciation schedule. Valuation date as of October 1, 2012
EVERCORE PARTNERS
31
Perpetuity
Growth Rate
$1,142
$1,141.7
(399.6)
$742.1
$742.1
0.5%
$4,362
35,291
$192
($300)
$5,183
232.0
$22.34
1.5%
$6,893
5,853
5,038
4,384
3,849
McMoRanView entire presentation