Sonos Investor Day Presentation Deck
Proven Track Record:
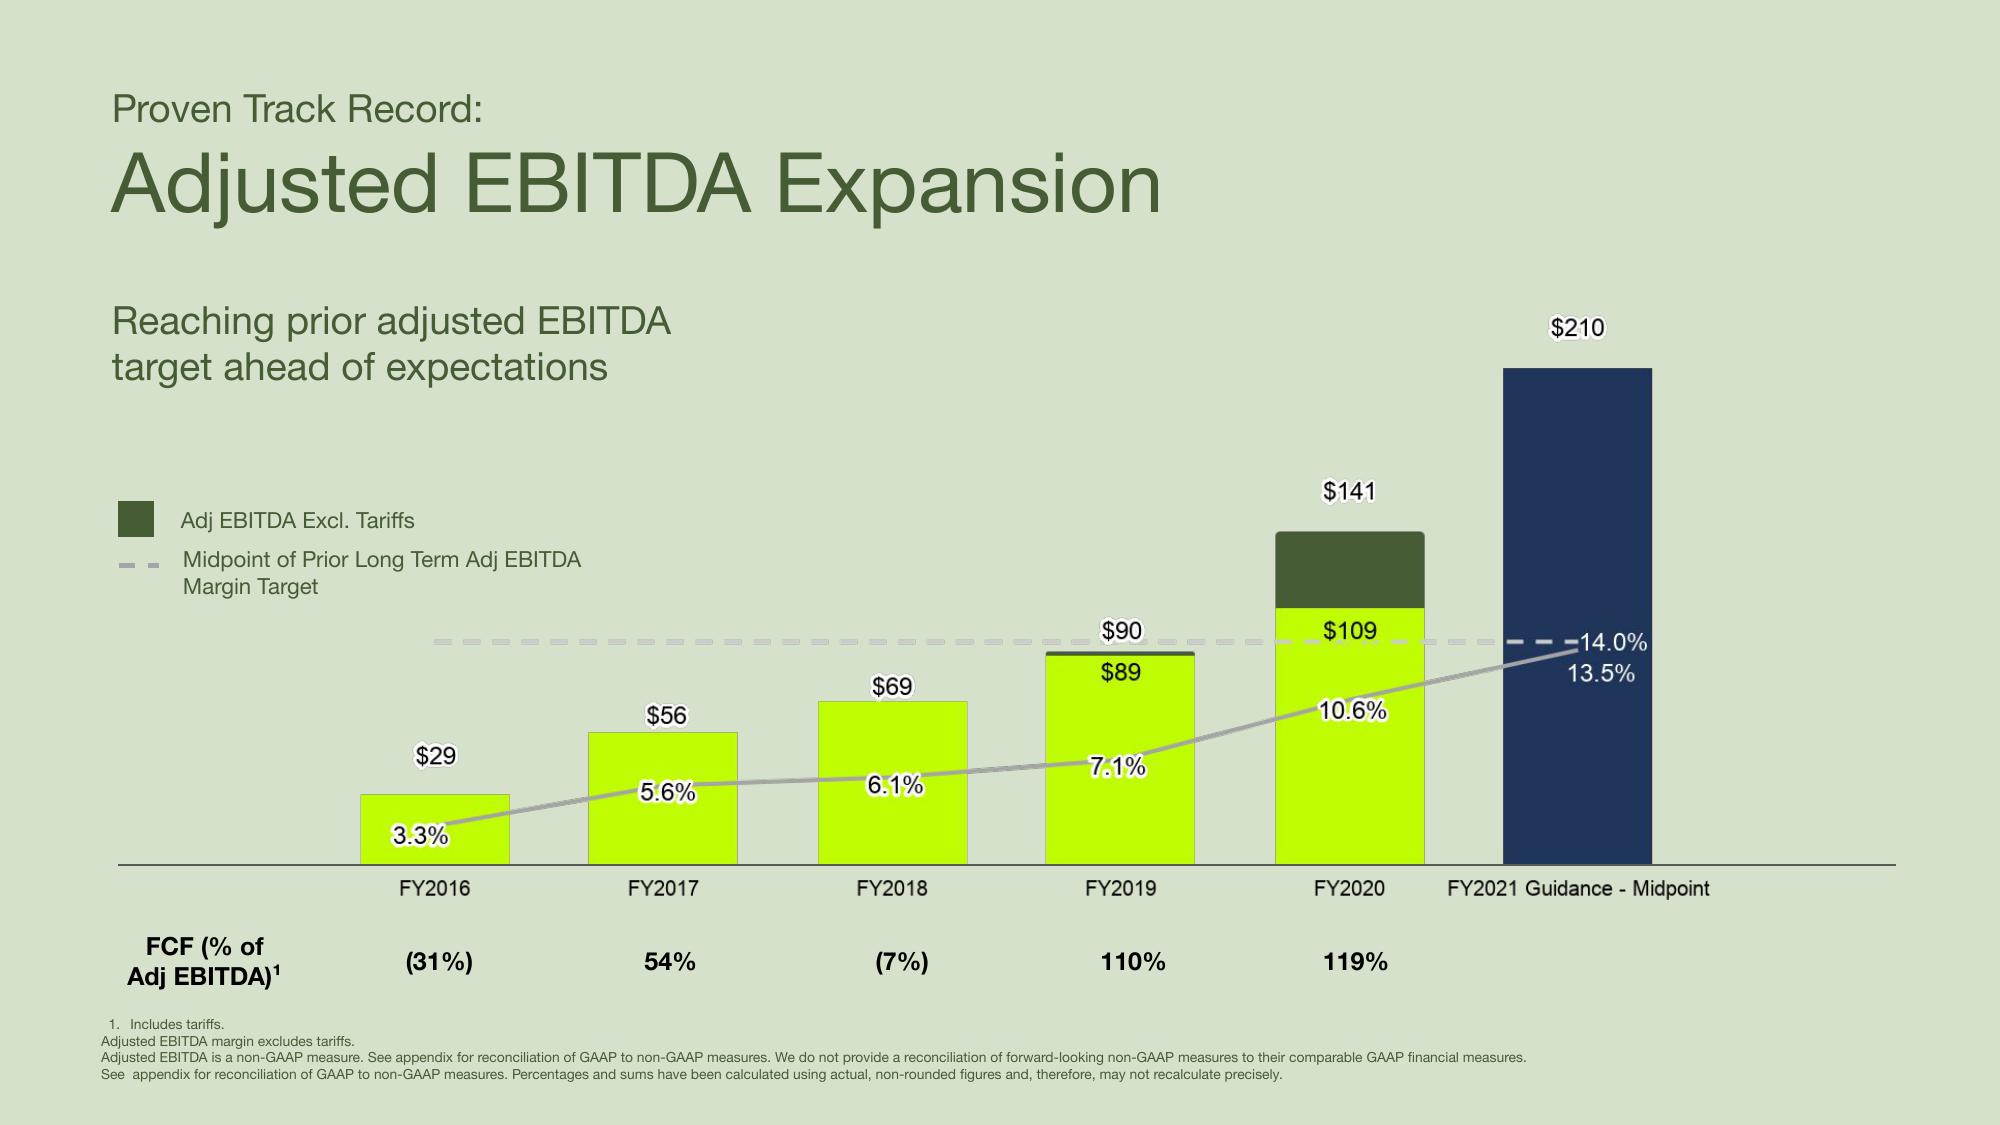
Adjusted EBITDA Expansion
Reaching prior adjusted EBITDA
target ahead of expectations
Adj EBITDA Excl. Tariffs
Midpoint of Prior Long Term Adj EBITDA
Margin Target
FCF (% of
Adj EBITDA)¹
$29
3.3%
FY2016
(31%)
$56
5.6%
FY2017
54%
$69
6.1%
FY2018
(7%)
$90
$89
7.1%
FY2019
110%
$141
$109
10.6%
FY2020
119%
$210
1. Includes tariffs.
Adjusted EBITDA margin excludes tariffs.
Adjusted EBITDA is a non-GAAP measure. See appendix for reconciliation of GAAP to non-GAAP measures. We do not provide a reconciliation of forward-looking non-GAAP measures to their comparable GAAP financial measures.
See appendix for reconciliation of GAAP to non-GAAP measures. Percentages and sums have been calculated using actual, non-rounded figures and, therefore, may not recalculate precisely.
-14.0%
13.5%
FY2021 Guidance - MidpointView entire presentation