Kinnevik Results Presentation Deck
Intro
Net Asset Value
Note 4 Financial Assets Accounted at
Fair Value Through Profit & Loss
OUR FRAMEWORK AND PRINCIPLES
In assessing the fair value of our unlisted investments, we apply IFRS
13 and the International Private Equity and Venture Capital Valuation
Guidelines, whereunder we make a collective assessment to establish
the valuation methods and points of reference that are suitable and rel-
evant in determining the fair value of each of our unlisted investments.
Valuations in recent transactions are not applied as a valuation method,
but typically provides important points of reference for our valuations.
When applicable, consideration is taken to preferential rights such as
liquidation preferences to proceeds in a sale or listing of a business.
Valuation methods include revenue, GMV, and profit multiples, with
consideration to differences in size, growth, profitability and cost of equity
capital. We also consider the strength of a company's financial position,
cash runway, and the funding environment.
The valuation process is led independently from the investment team.
Accuracy and reliability of financial information is ensured through con-
tinuous contacts with investee management teams and regular reviews
of their financial and operational reporting. Information and opinions on
applicable valuation methods are obtained periodically from investment
managers and well-renowned investment banks and audit firms. The val-
uations are approved by Kinnevik's CFO and CEO after which a proposal
is presented and discussed with the Audit & Sustainability Committee and
Kinnevik's external auditors. After their scrutiny and potential adjustments,
the valuations are approved by the Audit & Sustainability Committee and
included in Kinnevik's financial reports.
When establishing the fair value of other financial instruments, meth-
ods assumed to provide the best estimation of fair value are used. For
assets and liabilities maturing within one year, a nominal value adjusted
for interest payments and premiums is assumed to provide a good
approximation of fair value.
Information in this note is provided per class of financial instruments
that are valued at fair value in the balance sheet, distributed in the levels
stated below:
KINNEVIK
Interim Report Q3 2022
Portfolio Overview
Category
• Value-Based Care
• Virtual Care
• Platforms & Marketplaces
• Software
• Consumer Finance
Sustainability
2021
Kinnevik Unlisted Investee Averages
Revenue Growth
+105-125%
+215-235%
+40-60% / +140-160%
+130-150%
+30-50%
Note: Kinnevik unlisted investee averages are weighted by fair value.
2021
Gross Margin
5-15%
35-55%
30-40% / 60-80%
60-80%
50-70%
Financial Statements
NTM
EV/Revenue
Level 1: Fair value established based on listed prices in an active
market for the same instrument.
Level 2: Fair value established based on valuation techniques with
observable market data, either directly (as a price) or indirectly (derived
from a price) and not included in Level 1.
Level 3: Fair value established using valuation techniques, with sig-
nificant input from data that is not observable in the market.
For companies that are valued based on multiples, an increase in
the multiple by 10% would have increased the assessed fair value by
SEK 2,042m. Similarly, a decrease in the multiple by 10% would have
decreased the assessed fair value by SEK 2,053m.
A NEW VALUATION ENVIRONMENT
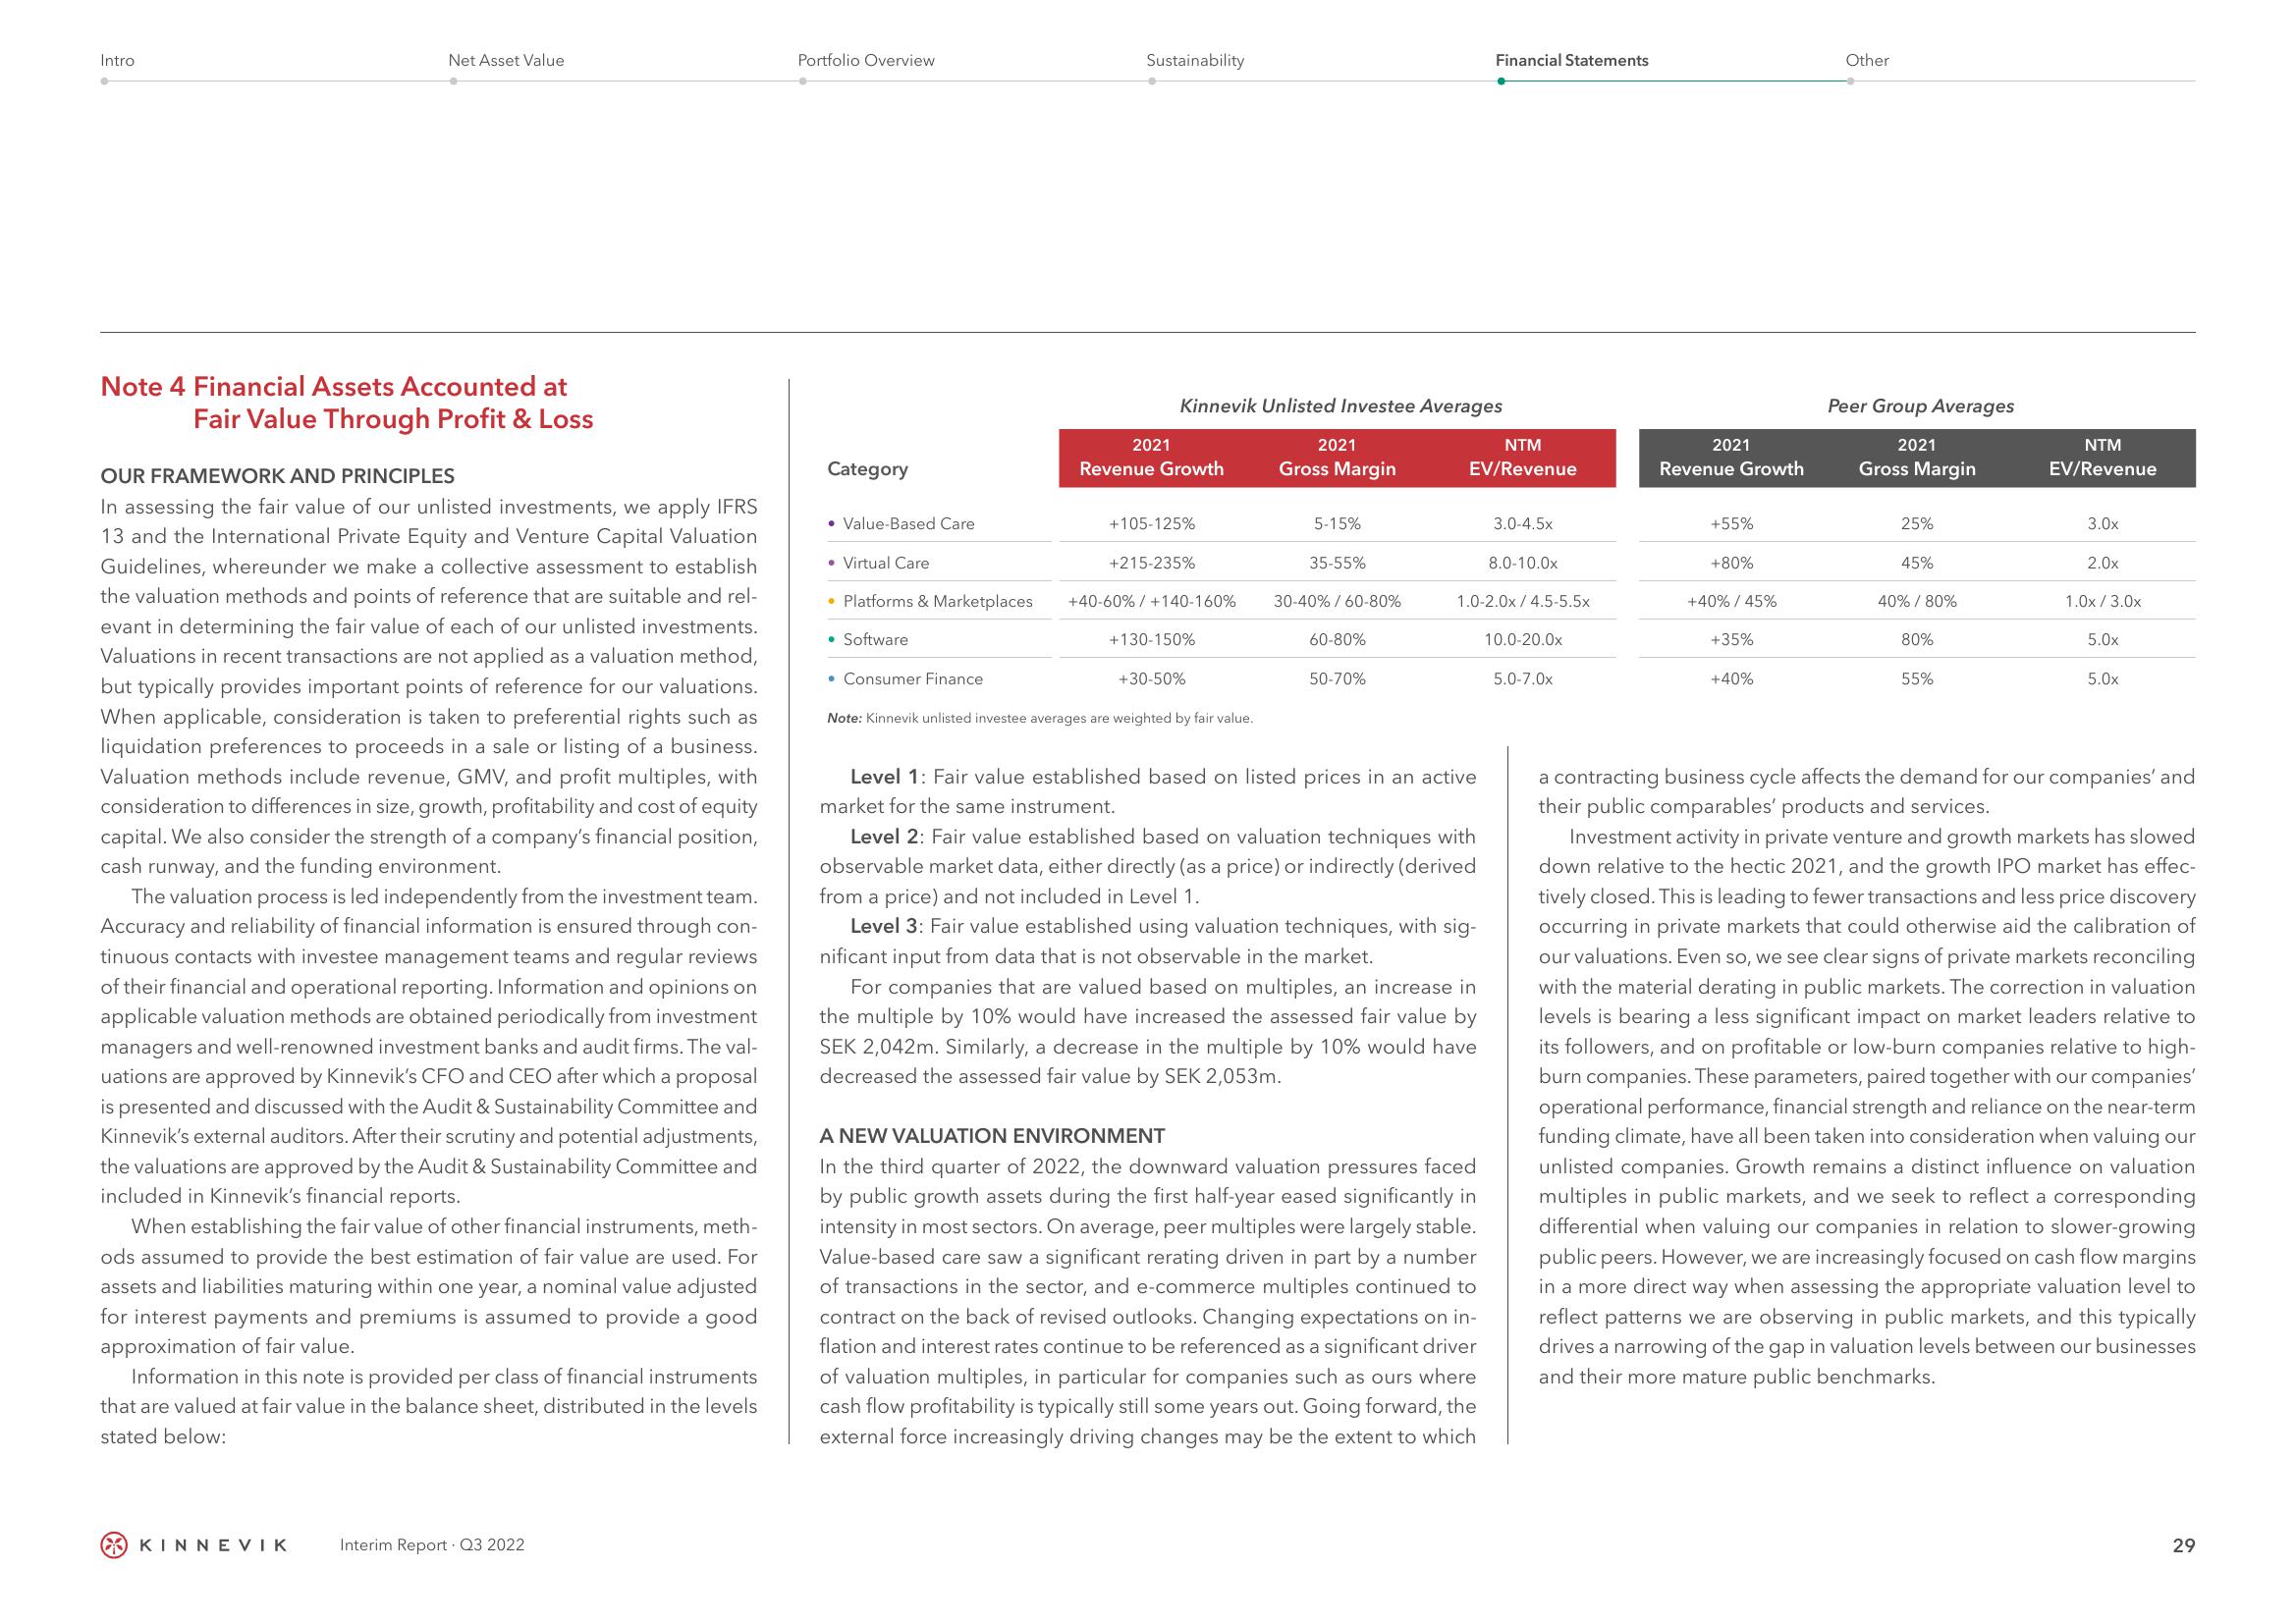
In the third quarter of 2022, the downward valuation pressures faced
by public growth assets during the first half-year eased significantly in
intensity in most sectors. On average, peer multiples were largely stable.
Value-based care saw a significant rerating driven in part by a number
of transactions in the sector, and e-commerce multiples continued to
contract on the back of revised outlooks. Changing expectations on in-
flation and interest rates continue to be referenced as a significant driver
of valuation multiples, in particular for companies such as ours where
cash flow profitability is typically still some years out. Going forward, the
external force increasingly driving changes may be the extent to which
3.0-4.5×
1.0-2.0x/4.5-5.5x
8.0-10.0x
10.0-20.0x
5.0-7.0x
2021
Revenue Growth
+55%
+80%
+40% / 45%
+35%
+40%
Other
Peer Group Averages
2021
Gross Margin
25%
45%
40% / 80%
80%
55%
NTM
EV/Revenue
3.0x
2.0x
1.0x/3.0x
5.0x
5.0x
a contracting business cycle affects the demand for our companies' and
their public comparables' products and services.
Investment activity in private venture and growth markets has slowed
down relative to the hectic 2021, and the growth IPO market has effec-
tively closed. This is leading to fewer transactions and less price discovery
occurring in private markets that could otherwise aid the calibration of
our valuations. Even so, we see clear signs of private markets reconciling
with the material derating in public markets. The correction in valuation
levels is bearing a less significant impact on market leaders relative to
its followers, and on profitable or low-burn companies relative to high-
burn companies. These parameters, paired together with our companies'
operational performance, financial strength and reliance on the near-term
funding climate, have all been taken into consideration when valuing our
unlisted companies. Growth remains a distinct influence on valuation
multiples in public markets, and we seek to reflect a corresponding
differential when valuing our companies in relation to slower-growing
public peers. However, we are increasingly focused on cash flow margins
in a more direct way when assessing the appropriate valuation level to
reflect patterns we are observing in public markets, and this typically
drives a narrowing of the gap in valuation levels between our businesses
and their more mature public benchmarks.
29View entire presentation