TPG Results Presentation Deck
Other Operating Metrics
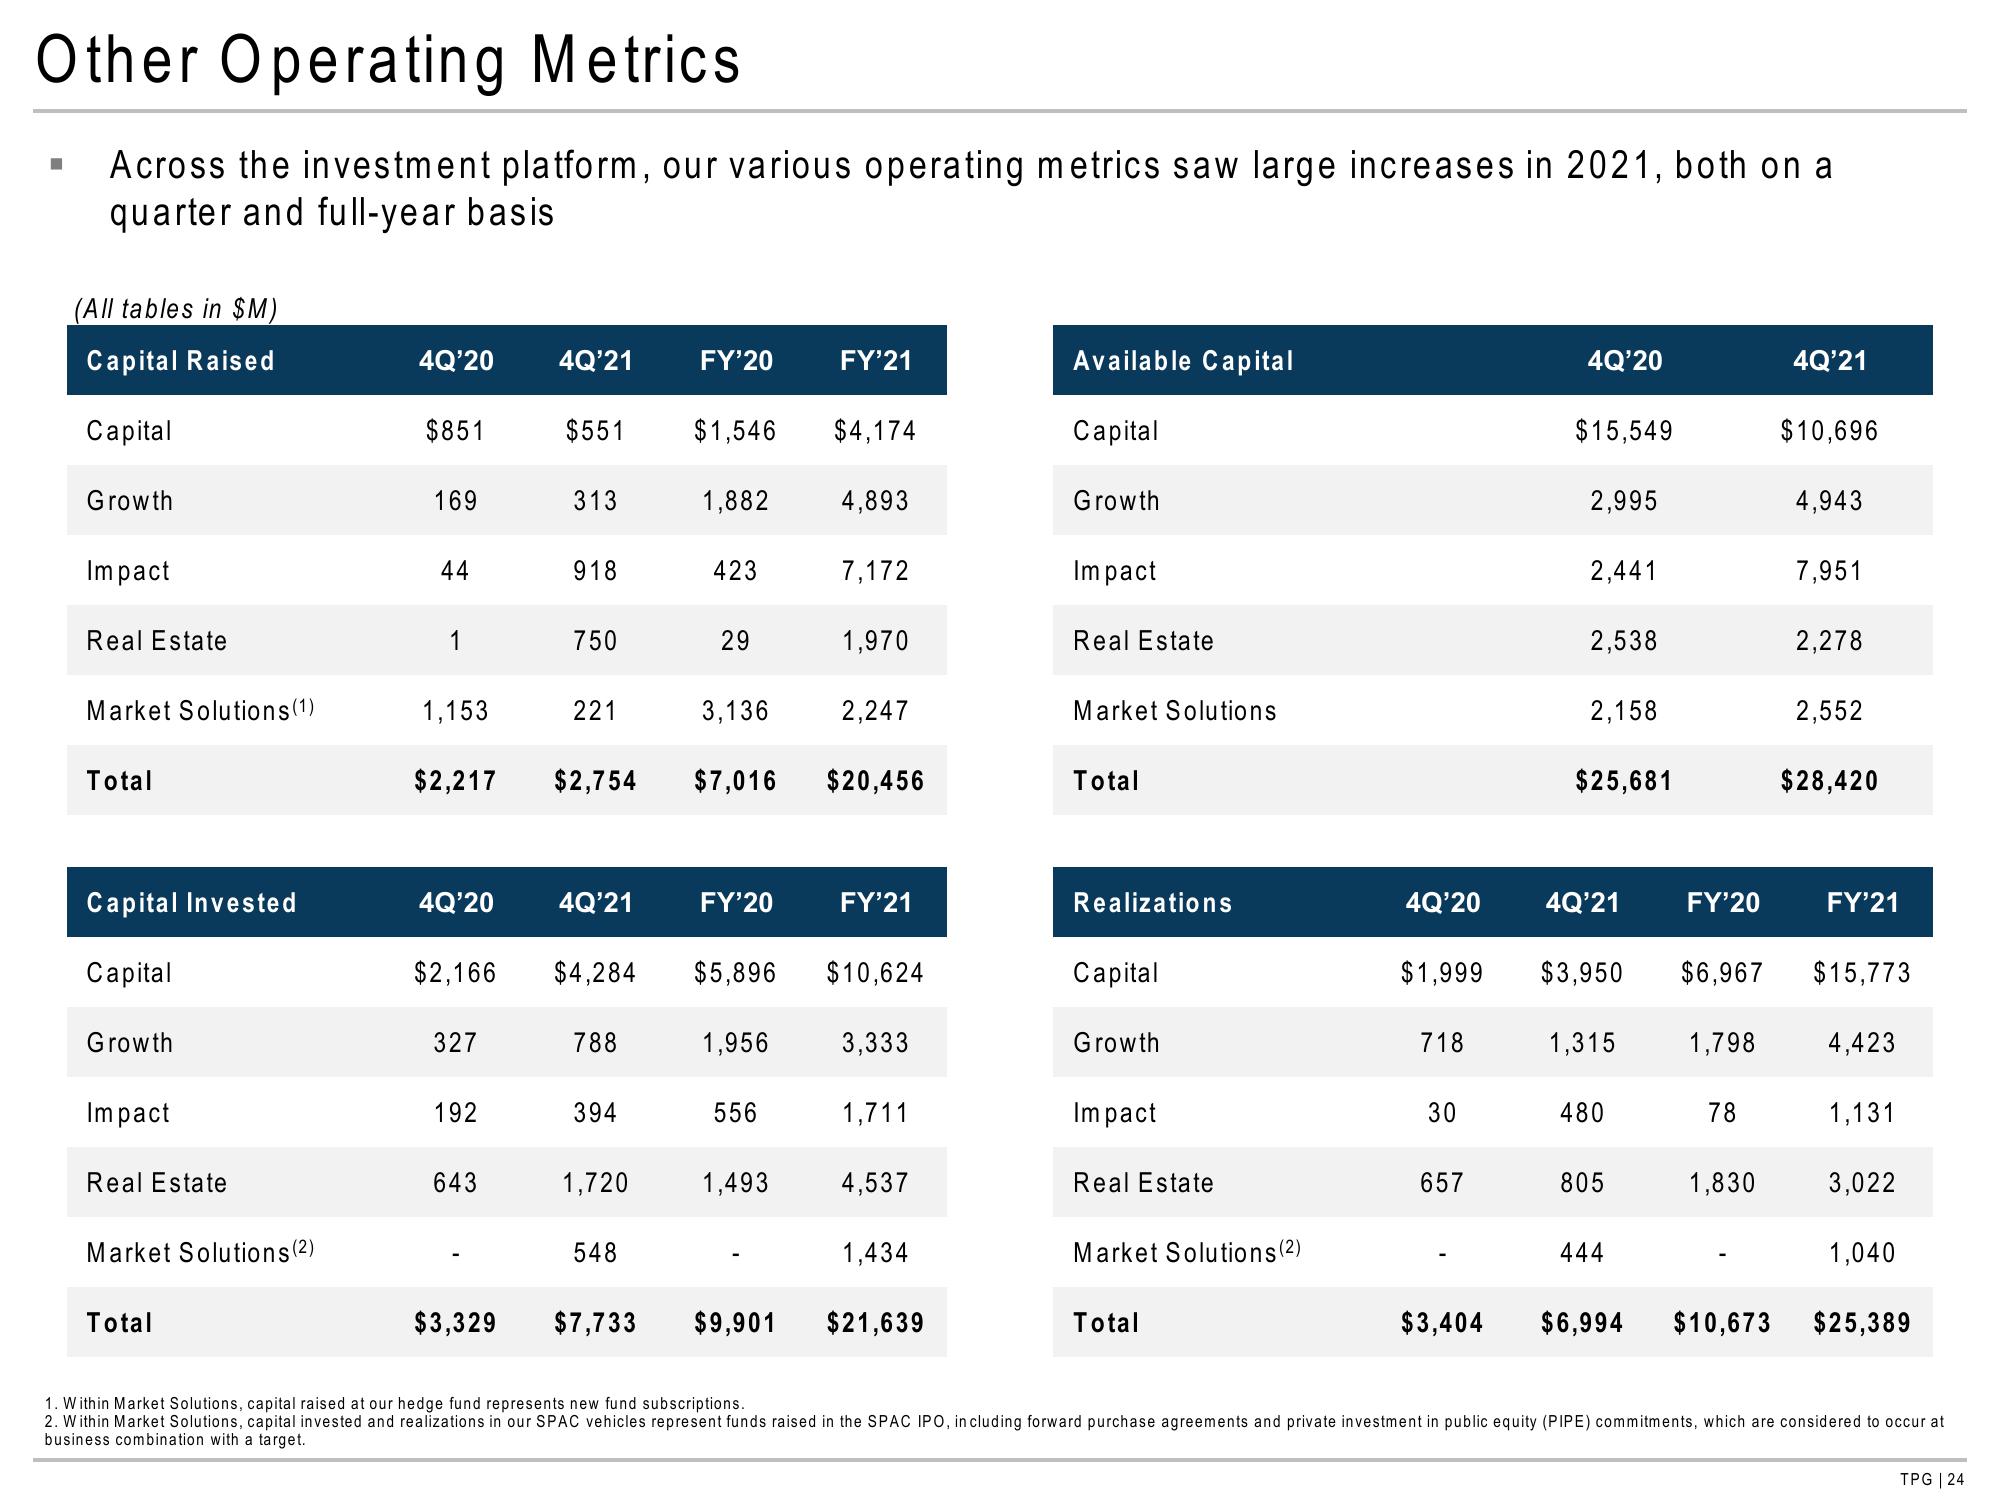
Across the investment platform, our various operating metrics saw large increases in 2021, both on a
quarter and full-year basis.
I
(All tables in $M)
Capital Raised
Capital
Growth
Impact
Real Estate
Market Solutions (1)
Total
Capital Invested
Capital
Growth
Impact
Real Estate
Market Solutions (2)
Total
4Q'20
$851
169
44
1
1,153
4Q'20
$2,166
327
192
643
4Q'21
$2,217 $2,754
$3,329
$551
313
918
750
221
4Q'21
$4,284
788
394
1,720
548
$7,733
FY'20
$1,546 $4,174
1,882
423
29
3,136
$7,016
FY'20
$5,896
1,956
556
1,493
FY'21
$9,901
4,893
7,172
1,970
2,247
$20,456
FY'21
$10,624
3,333
1,711
4,537
1,434
$21,639
Available Capital
Capital
Growth
Impact
Real Estate
Market Solutions
Total
Realizations
Capital
Growth
Impact
Real Estate
Market Solutions (2)
Total
4Q'20
$1,999
718
30
657
$3,404
4Q'20
$15,549
2,995
2,441
2,538
2,158
$25,681
4Q'21
1,315
480
805
FY'20
444
1,798
78
1,830
4Q'21
$3,950 $6,967 $15,773
$6,994 $10,673
$10,696
4,943
7,951
2,278
2,552
$28,420
FY'21
4,423
1,131
3,022
1,040
$25,389
1. Within Market Solutions, capital raised at our hedge fund represents new fund subscriptions.
2. Within Market Solutions, capital invested and realizations in our SPAC vehicles represent funds raised in the SPAC IPO, including forward purchase agreements and private investment in public equity (PIPE) commitments, which are considered to occur at
business combination with a target.
TPG | 24View entire presentation