arm IPO Presentation Deck
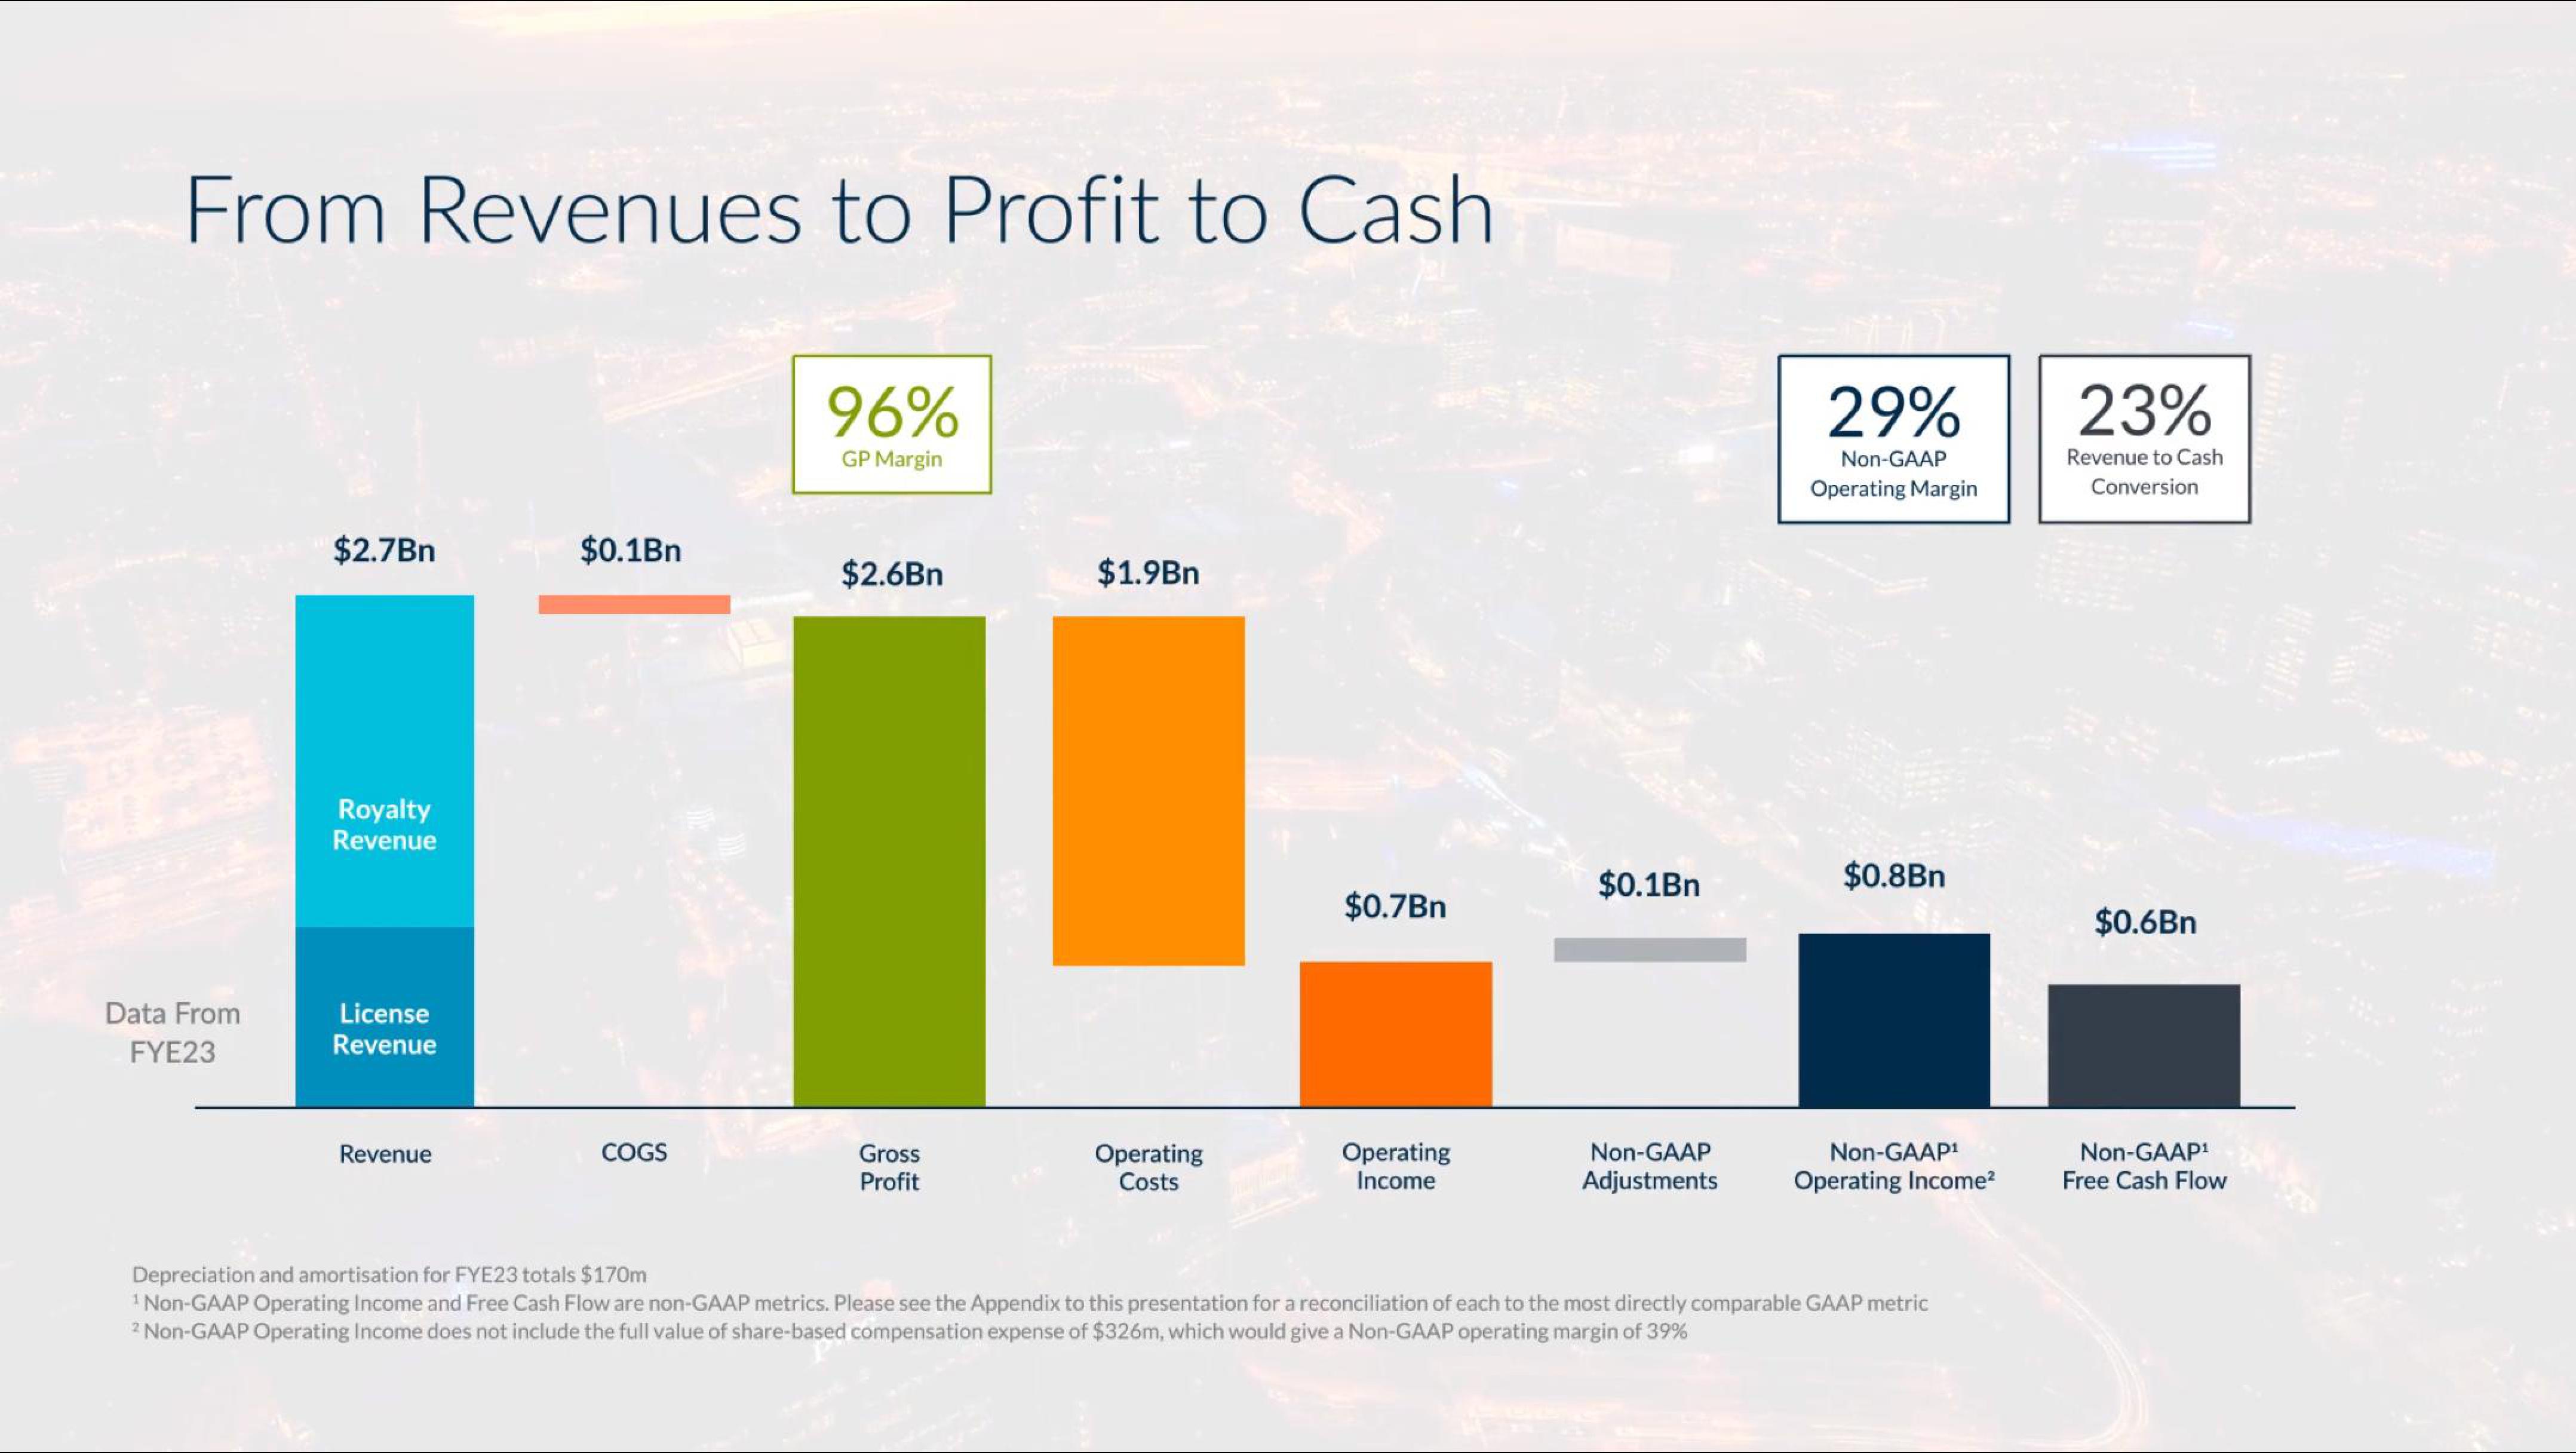
From Revenues to Profit to Cash
Data From
FYE23
$2.7Bn
Royalty
Revenue
License
Revenue
Revenue
$0.1Bn
COGS
96%
GP Margin
$2.6Bn
Gross
Profit
$1.9Bn
Operating
Costs
$0.7Bn
Operating
Income
$0.1Bn
Non-GAAP
Adjustments
29%
Non-GAAP
Operating Margin
$0.8Bn
Non-GAAP¹
Operating Income²
Depreciation and amortisation for FYE23 totals $170m
¹ Non-GAAP Operating Income and Free Cash Flow are non-GAAP metrics. Please see the Appendix to this presentation for a reconciliation of each to the most directly comparable GAAP metric
2 Non-GAAP Operating Income does not include the full value of share-based compensation expense of $326m, which would give a Non-GAAP operating margin of 39%
23%
Revenue to Cash
Conversion
$0.6Bn
Non-GAAP¹
Free Cash FlowView entire presentation