Bakkt Results Presentation Deck
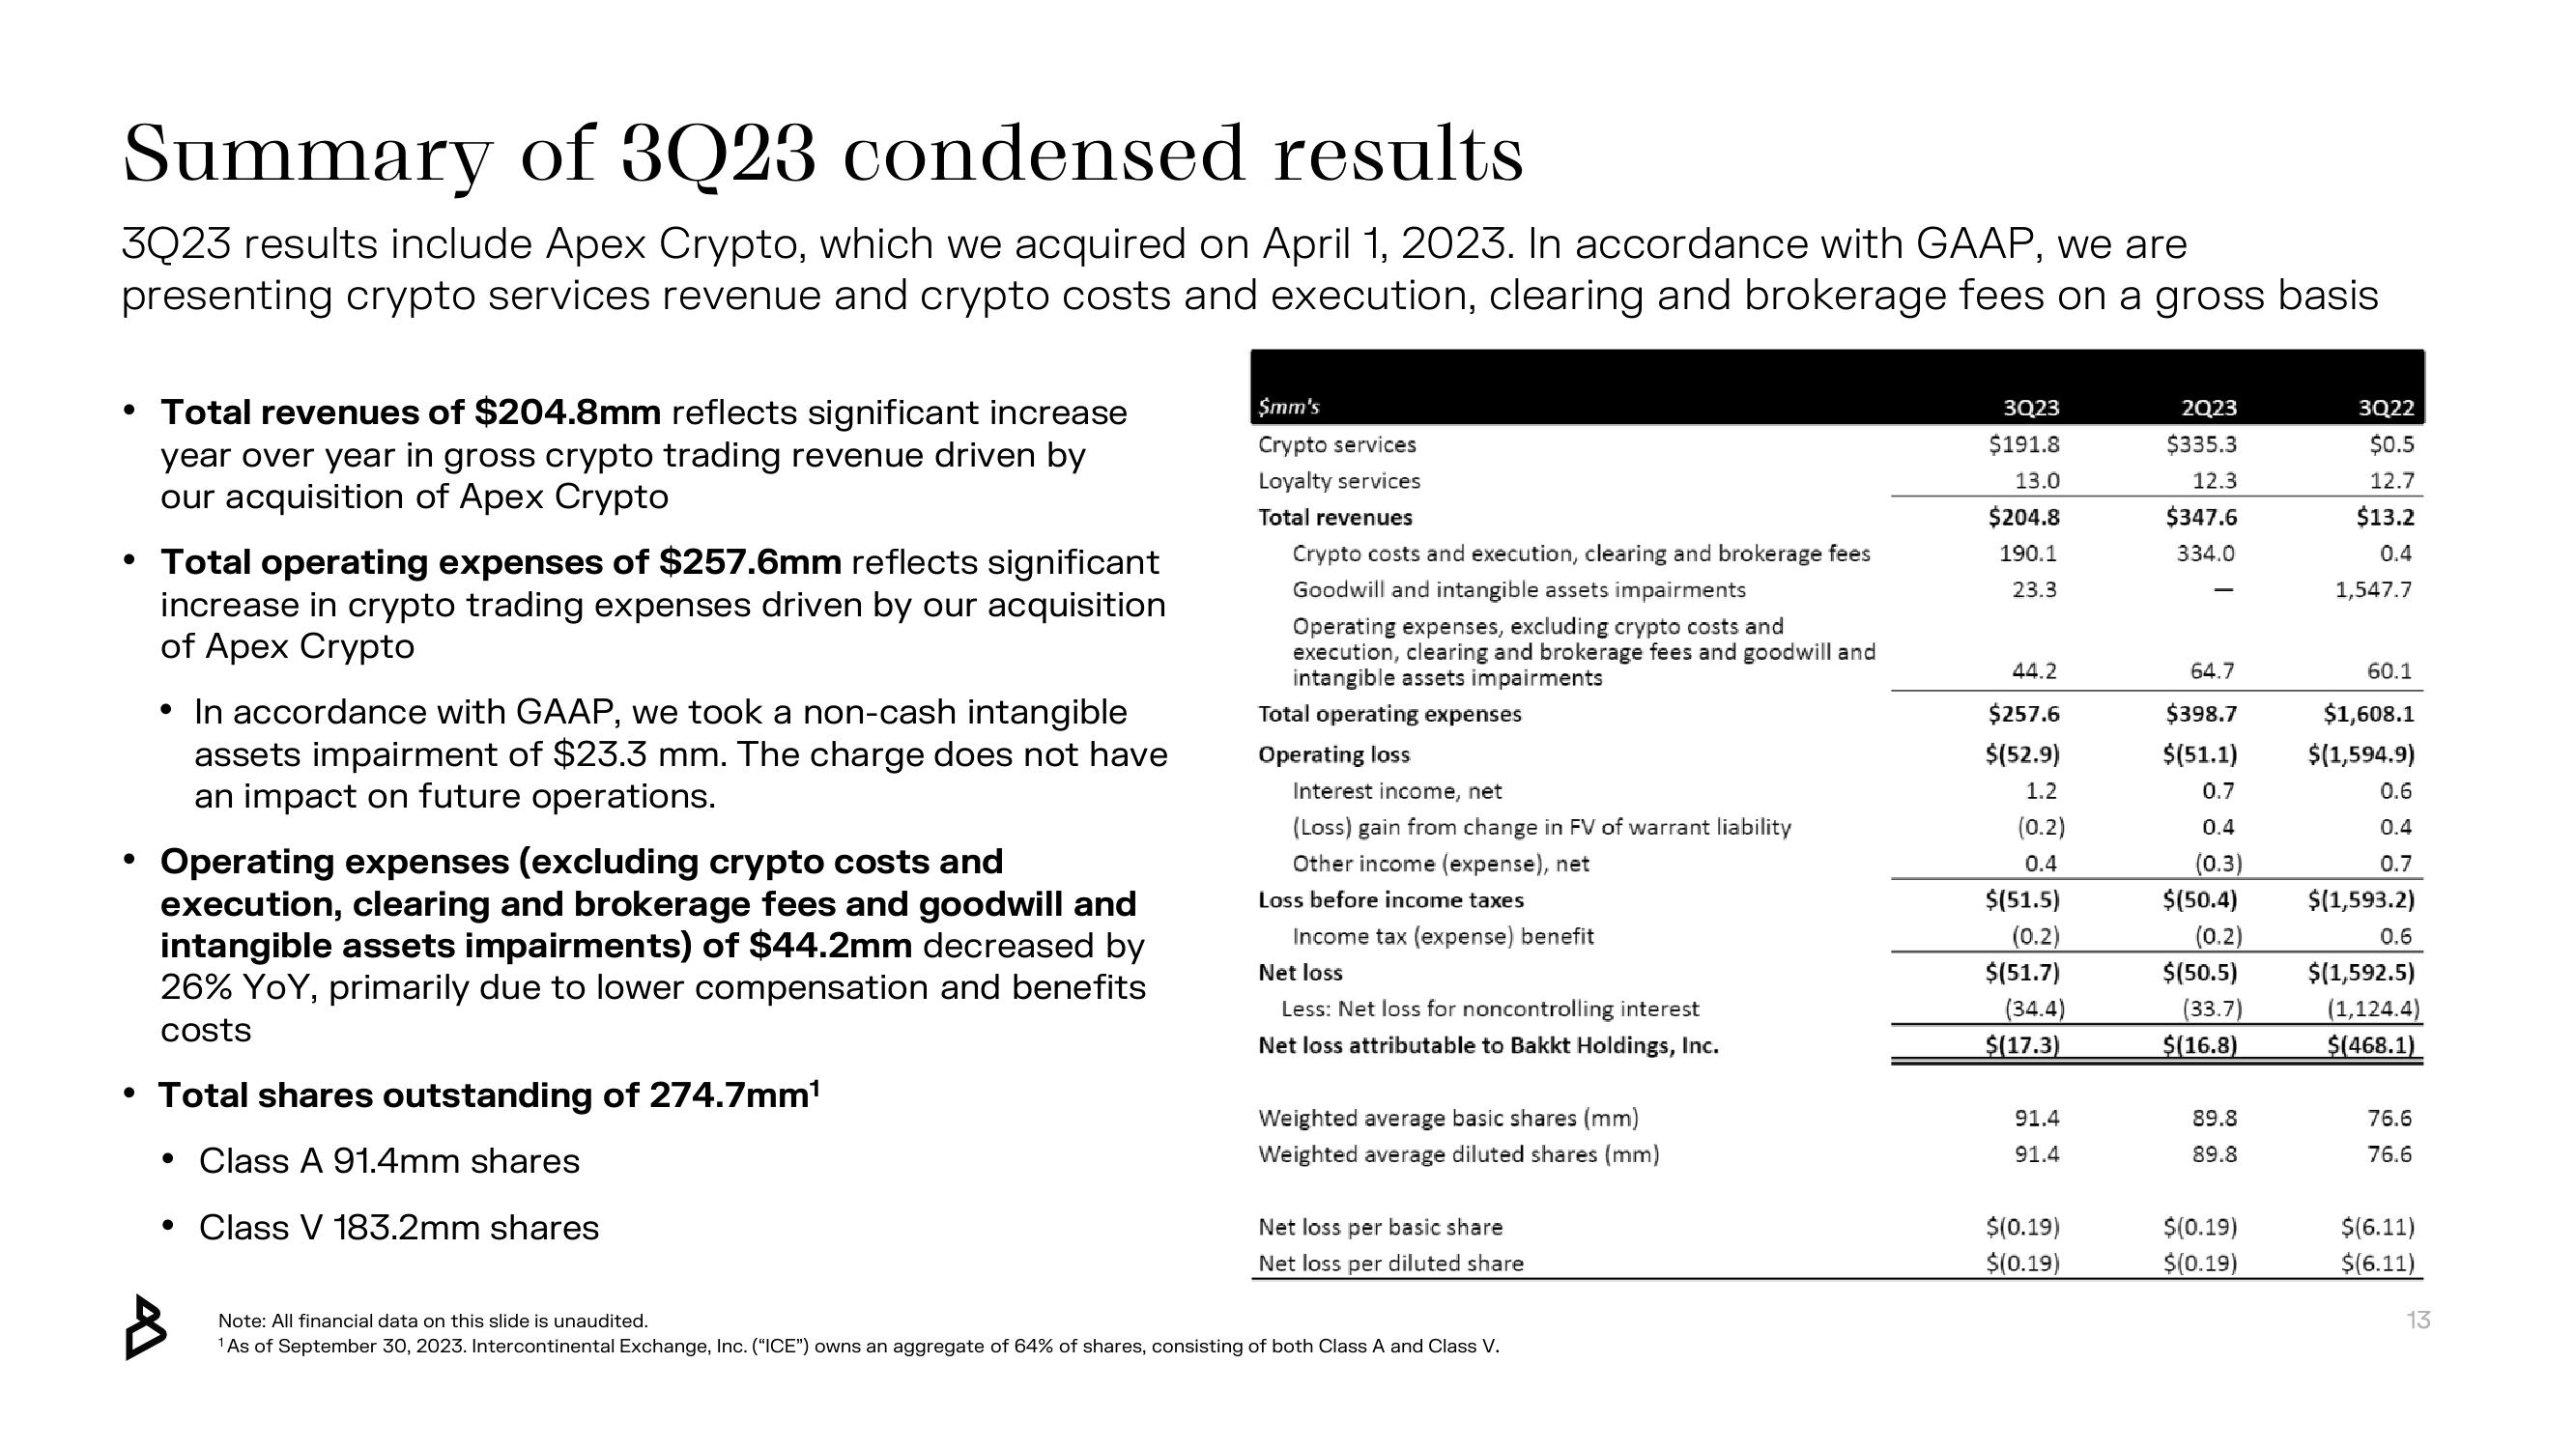
Summary of 3Q23 condensed results
3Q23 results include Apex Crypto, which we acquired on April 1, 2023. In accordance with GAAP, we are
presenting crypto services revenue and crypto costs and execution, clearing and brokerage fees on a gross basis
• Total revenues of $204.8mm reflects significant increase
year over year in gross crypto trading revenue driven by
our acquisition of Apex Crypto
• Total operating expenses of $257.6mm reflects significant
increase in crypto trading expenses driven by our acquisition
of Apex Crypto
●
• In accordance with GAAP, we took a non-cash intangible
assets impairment of $23.3 mm. The charge does not have
an impact on future operations.
Operating expenses (excluding crypto costs and
execution, clearing and brokerage fees and goodwill and
intangible assets impairments) of $44.2mm decreased by
26% YOY, primarily due to lower compensation and benefits
costs
• Total shares outstanding of 274.7mm¹
• Class A 91.4mm shares
• Class V 183.2mm shares
$mm's
Crypto services
Loyalty services
Total revenues
Crypto costs and execution, clearing and brokerage fees
Goodwill and intangible assets impairments
Operating expenses, excluding crypto costs and
execution, clearing and brokerage fees and goodwill and
intangible assets impairments
Total operating expenses
Operating loss
Interest income, net
(Loss) gain from change in FV of warrant liability
Other income (expense), net
Loss before income taxes
Income tax (expense) benefit
Net loss
Less: Net loss for noncontrolling interest
Net loss attributable to Bakkt Holdings, Inc.
Weighted average basic shares (mm)
Weighted average diluted shares (mm)
Net loss per basic share
Net loss per diluted share
Note: All financial data on this slide is unaudited.
¹ As of September 30, 2023. Intercontinental Exchange, Inc. ("ICE") owns an aggregate of 64% of shares, consisting of both Class A and Class V.
3Q23
$191.8
13.0
$204.8
190.1
23.3
44.2
$257.6
$(52.9)
1.2
(0.2)
0.4
$(51.5)
(0.2)
$(51.7)
(34.4)
$(17.3)
91.4
91.4
$(0.19)
$(0.19)
2Q23
$335.3
12.3
$347.6
334.0
64.7
$398.7
$(51.1)
0.7
0.4
(0.3)
$(50.4)
(0.2)
$(50.5)
(33.7)
$(16.8)
89.8
89.8
$(0.19)
$(0.19)
3Q22
$0.5
12.7
$13.2
0.4
1,547.7
60.1
$1,608.1
$(1,594.9)
0.6
0.4
0.7
$(1,593.2)
0.6
$(1,592.5)
(1,124.4)
$(468.1)
76.6
76.6
$(6.11)
$(6.11)
13View entire presentation