Lumen Investor Presentation Deck
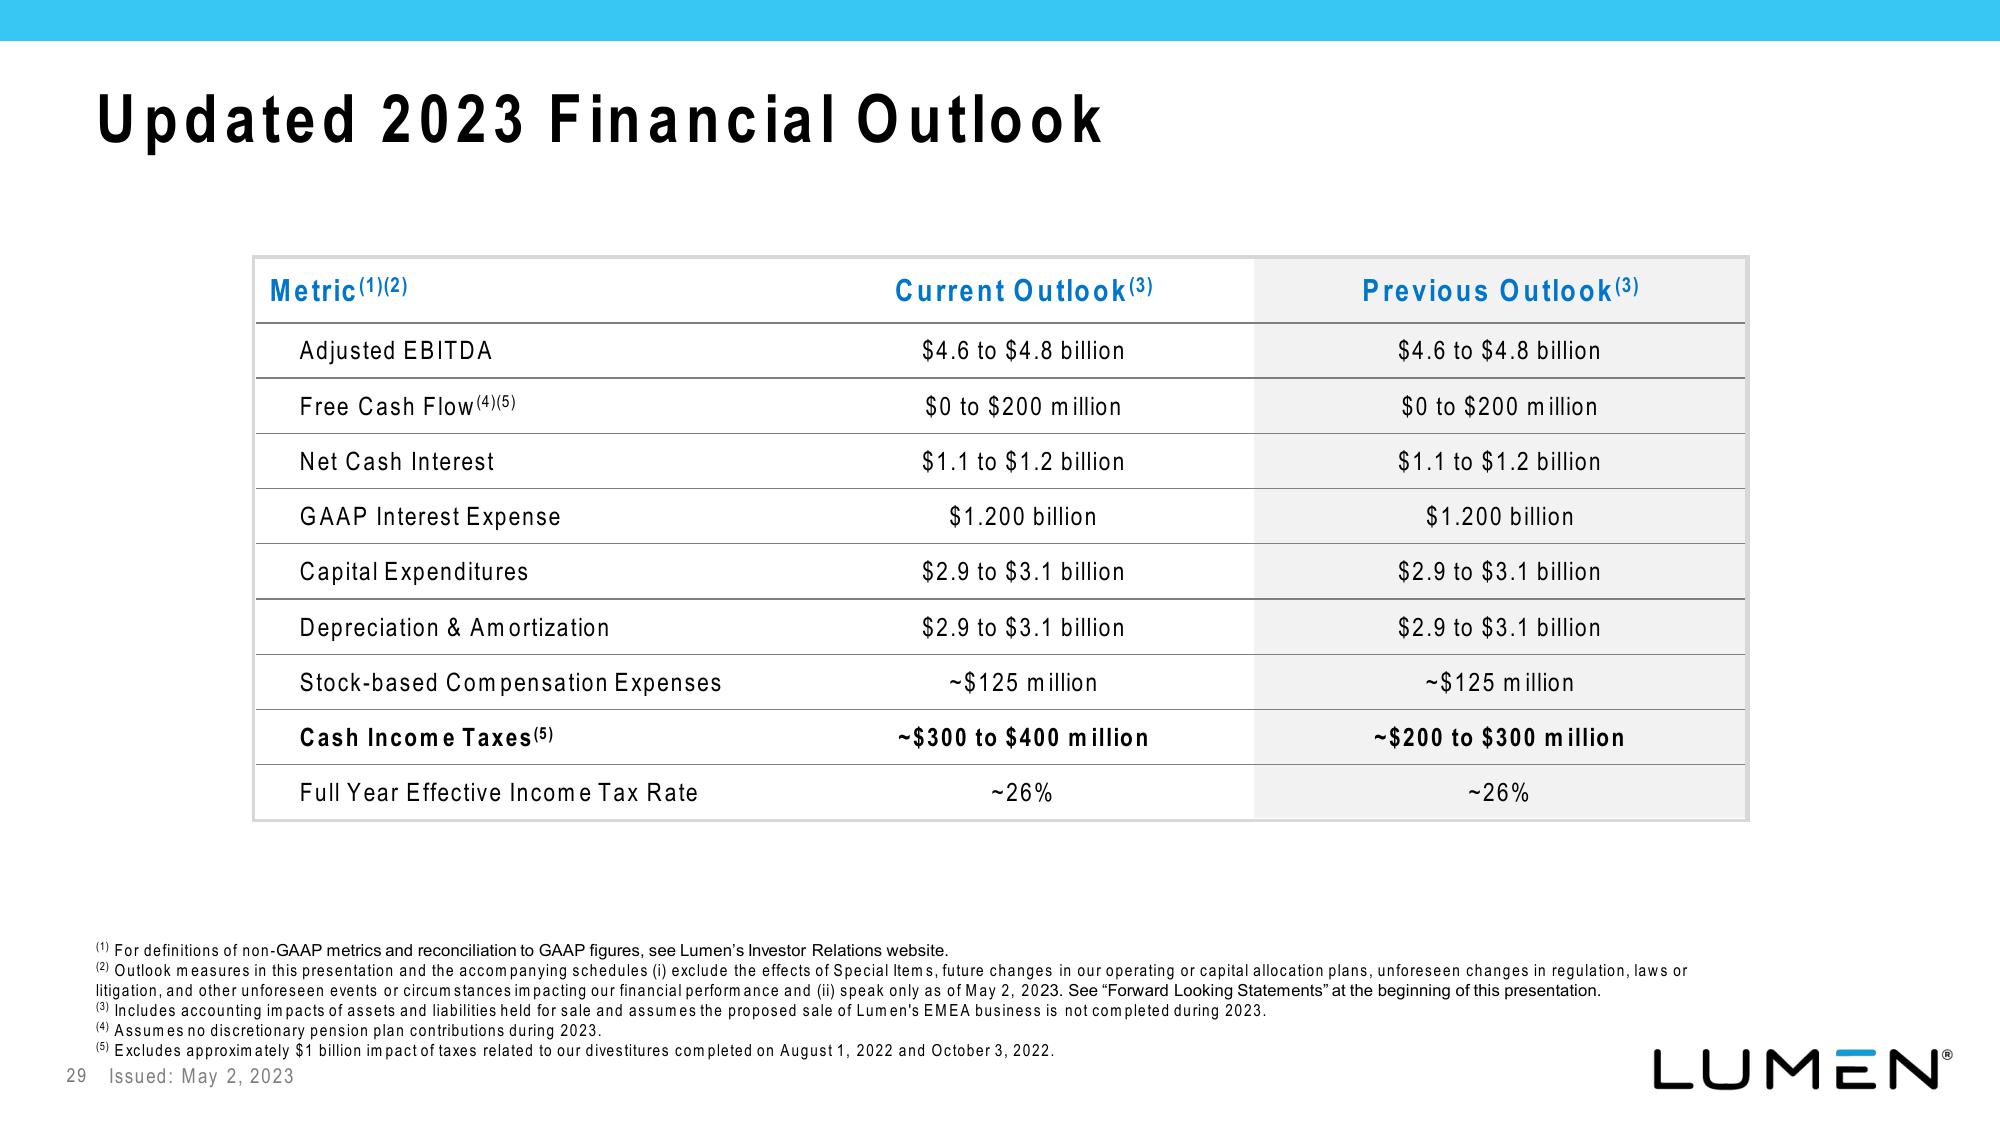
Updated 2023 Financial Outlook
Metric (1)(2)
Adjusted EBITDA
Free Cash Flow (4)(5)
Net Cash Interest
GAAP Interest Expense
Capital Expenditures
Depreciation & Amortization
Stock-based Compensation Expenses
Cash Income Taxes (5)
Full Year Effective Income Tax Rate
Current Outlook (3)
$4.6 to $4.8 billion.
$0 to $200 million
$1.1 to $1.2 billion
$1.200 billion
$2.9 to $3.1 billion.
$2.9 to $3.1 billion
-$125 million
-$300 to $400 million
-26%
Previous Outlook (³)
$4.6 to $4.8 billion
$0 to $200 million
$1.1 to $1.2 billion
$1.200 billion
$2.9 to $3.1 billion
$2.9 to $3.1 billion
~$125 million
-$200 to $300 million
-26%
(1) For definitions of non-GAAP metrics and reconciliation to GAAP figures, see Lumen's Investor Relations website.
(2) Outlook measures in this presentation and the accompanying schedules (i) exclude the effects of Special Items, future changes in our operating or capital allocation plans, unforeseen changes in regulation, laws or
litigation, and other unforeseen events or circumstances impacting our financial performance and (ii) speak only as of May 2, 2023. See "Forward Looking Statements" at the beginning of this presentation.
(3) Includes accounting impacts of assets and liabilities held for sale and assumes the proposed sale of Lumen's EMEA business is not completed during 2023.
(4) Assumes no discretionary pension plan contributions during 2023.
(5) Excludes approximately $1 billion impact of taxes related to our divestitures completed on August 1, 2022 and October 3, 2022.
29
Issued: May 2, 2023
LUMENⓇView entire presentation