Quanergy SPAC Presentation Deck
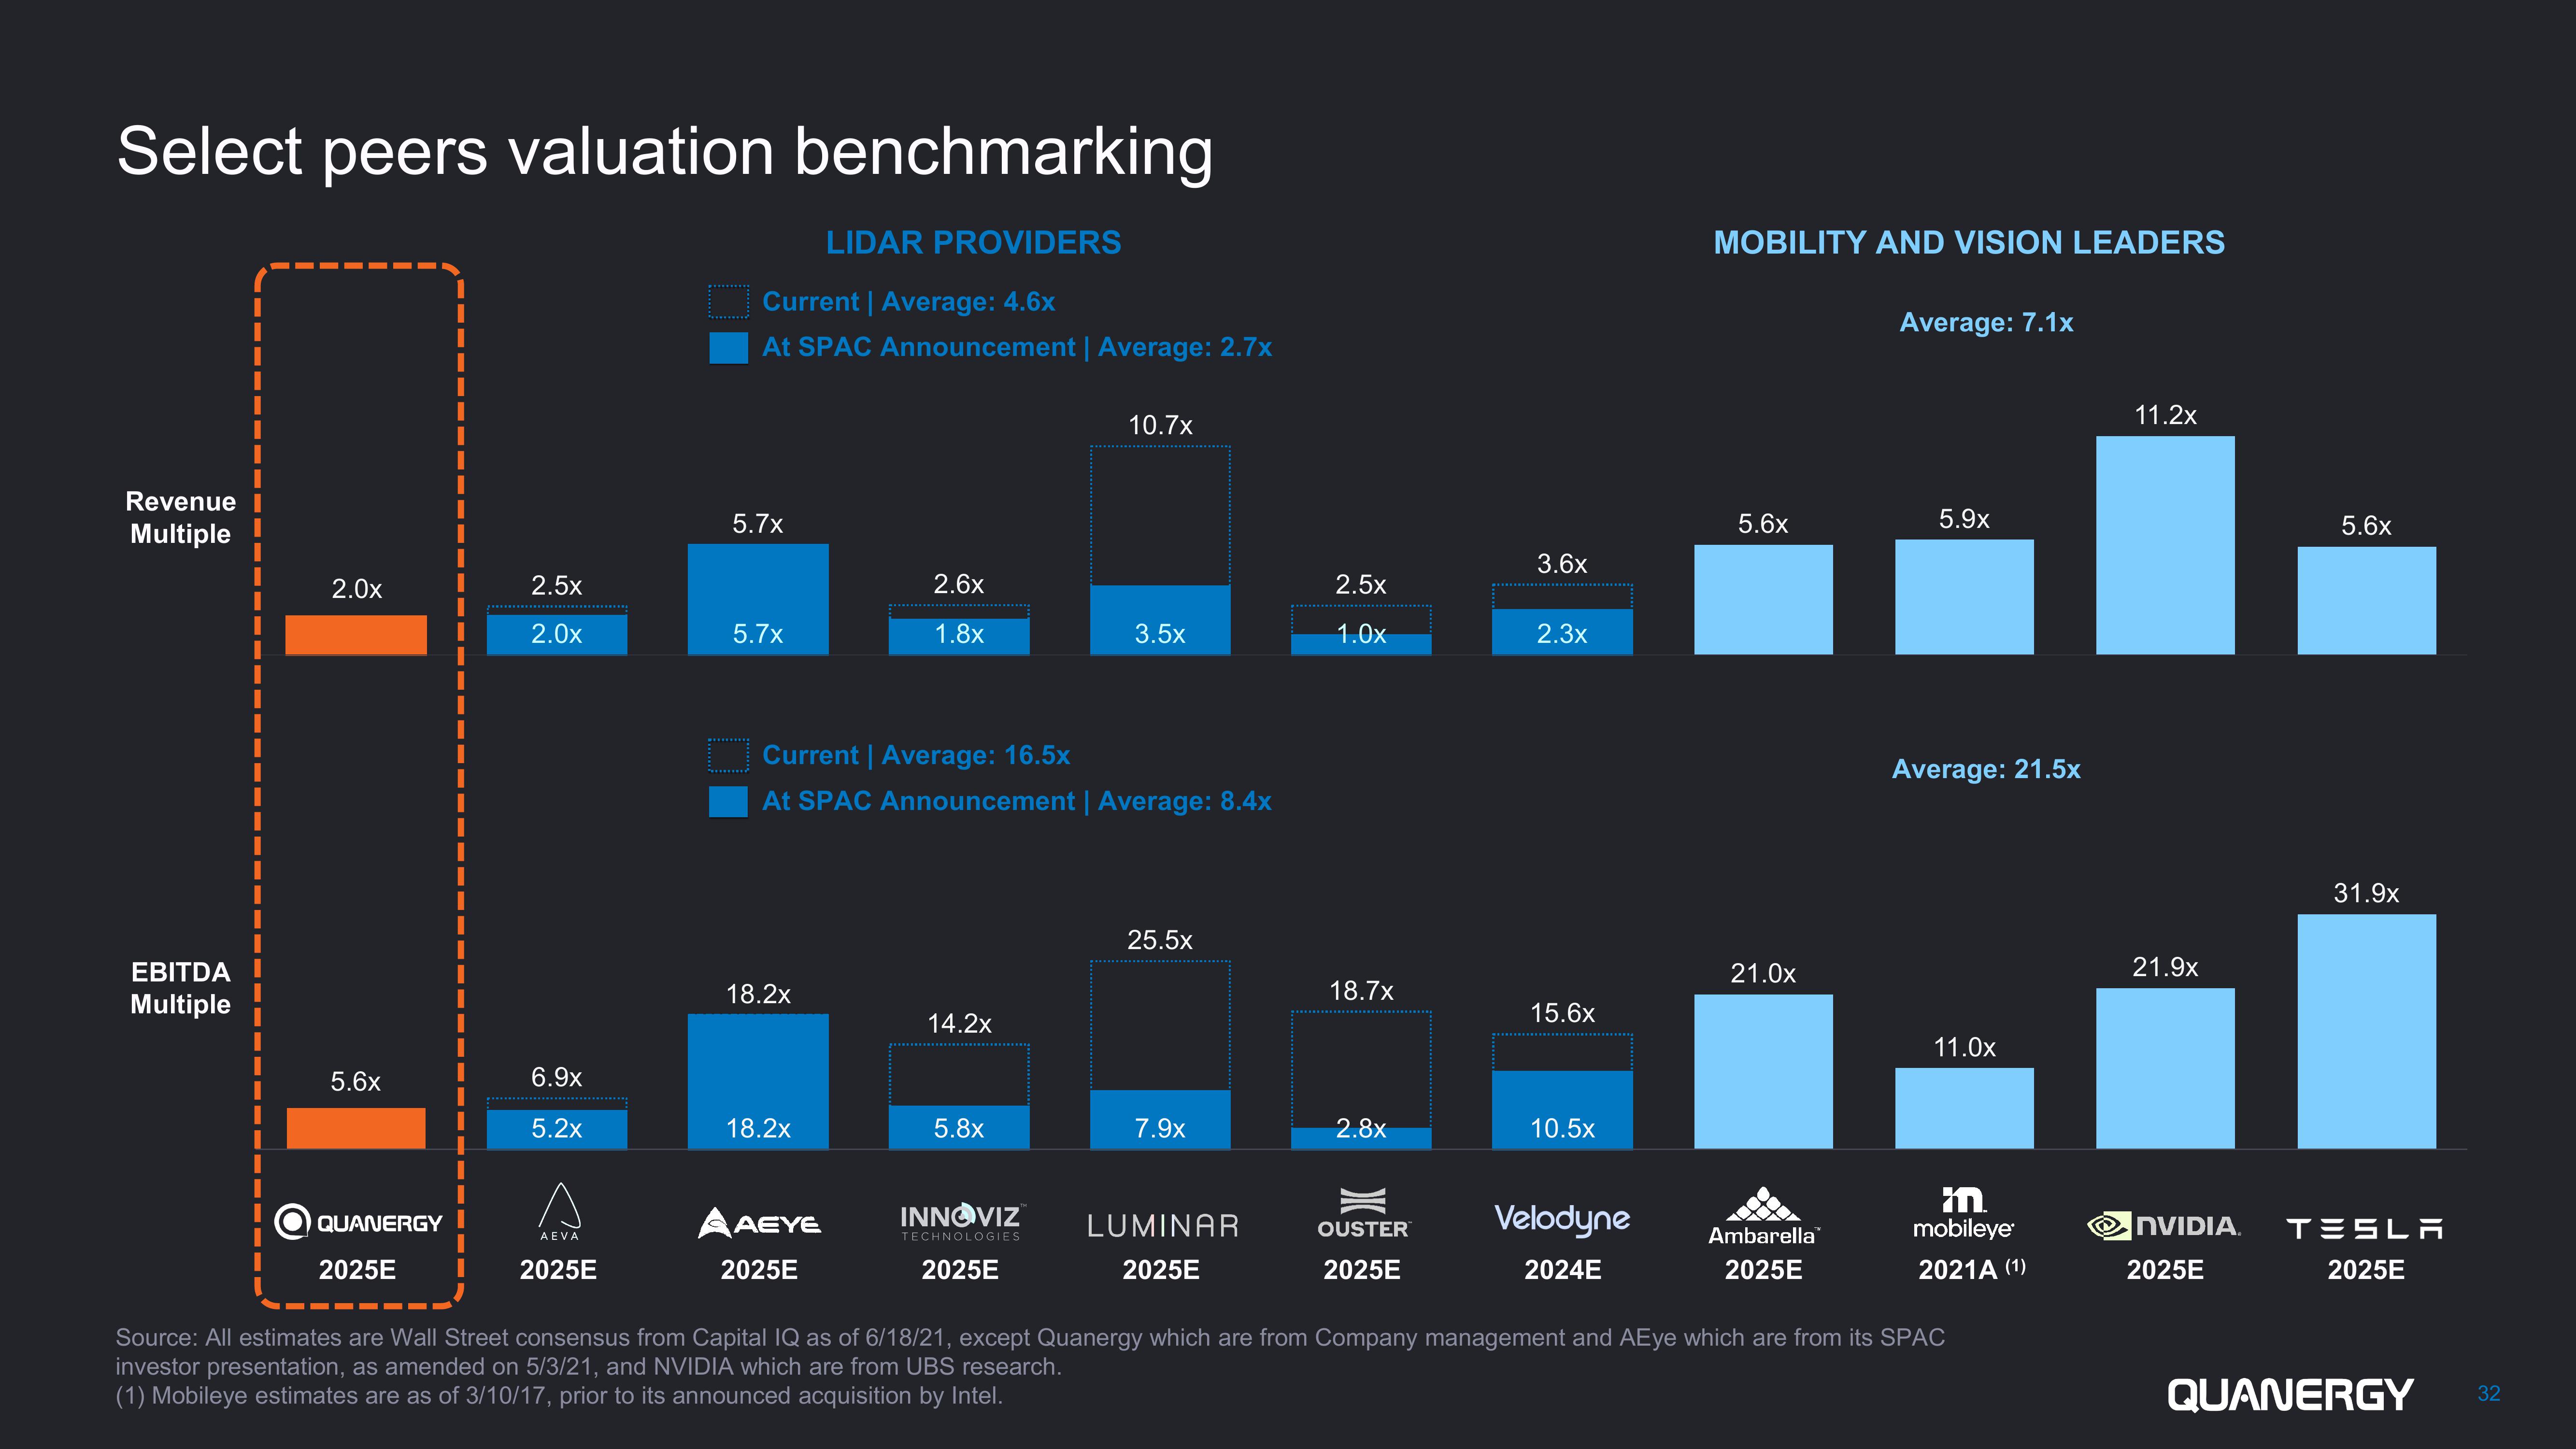
Select peers valuation benchmarking
LIDAR PROVIDERS
Revenue
Multiple
EBITDA
Multiple
I
2.0x
5.6x
QUANERGY
2025E
I
I
I
2.5x
2.0x
6.9x
5.2x
AEVA
2025E
Current | Average: 4.6x
At SPAC Announcement | Average: 2.7x
5.7x
5.7x
18.2x
18.2x
2.6x
1.8x
Current | Average: 16.5x
At SPAC Announcement | Average: 8.4x
AAEYE
2025E
14.2x
5.8x
10.7x
INNOVIZ
TECHNOLOGIES
2025E
3.5x
25.5×
7.9x
LUMINAR
2025E
2.5x
1.0x
18.7x
2.8x
OUSTER
2025E
3.6x
2.3x
15.6x
10.5×
Velodyne
2024E
MOBILITY AND VISION LEADERS
5.6x
21.0x
Ambarella
2025E
Average: 7.1x
5.9x
Average: 21.5x
11.0x
m
mobileye
2021A (1)
Source: All estimates are Wall Street consensus from Capital IQ as of 6/18/21, except Quanergy which are from Company management and AEye which are from its SPAC
investor presentation, as amended on 5/3/21, and NVIDIA which are from UBS research.
(1) Mobileye estimates are as of 3/10/17, prior to its announced acquisition by Intel.
11.2x
21.9x
NVIDIA
2025E
5.6x
31.9x
TESLA
2025E
QUANERGY
32View entire presentation