Tao Overview Presentation to State of Connecticut Retirement Plans and Trust Funds
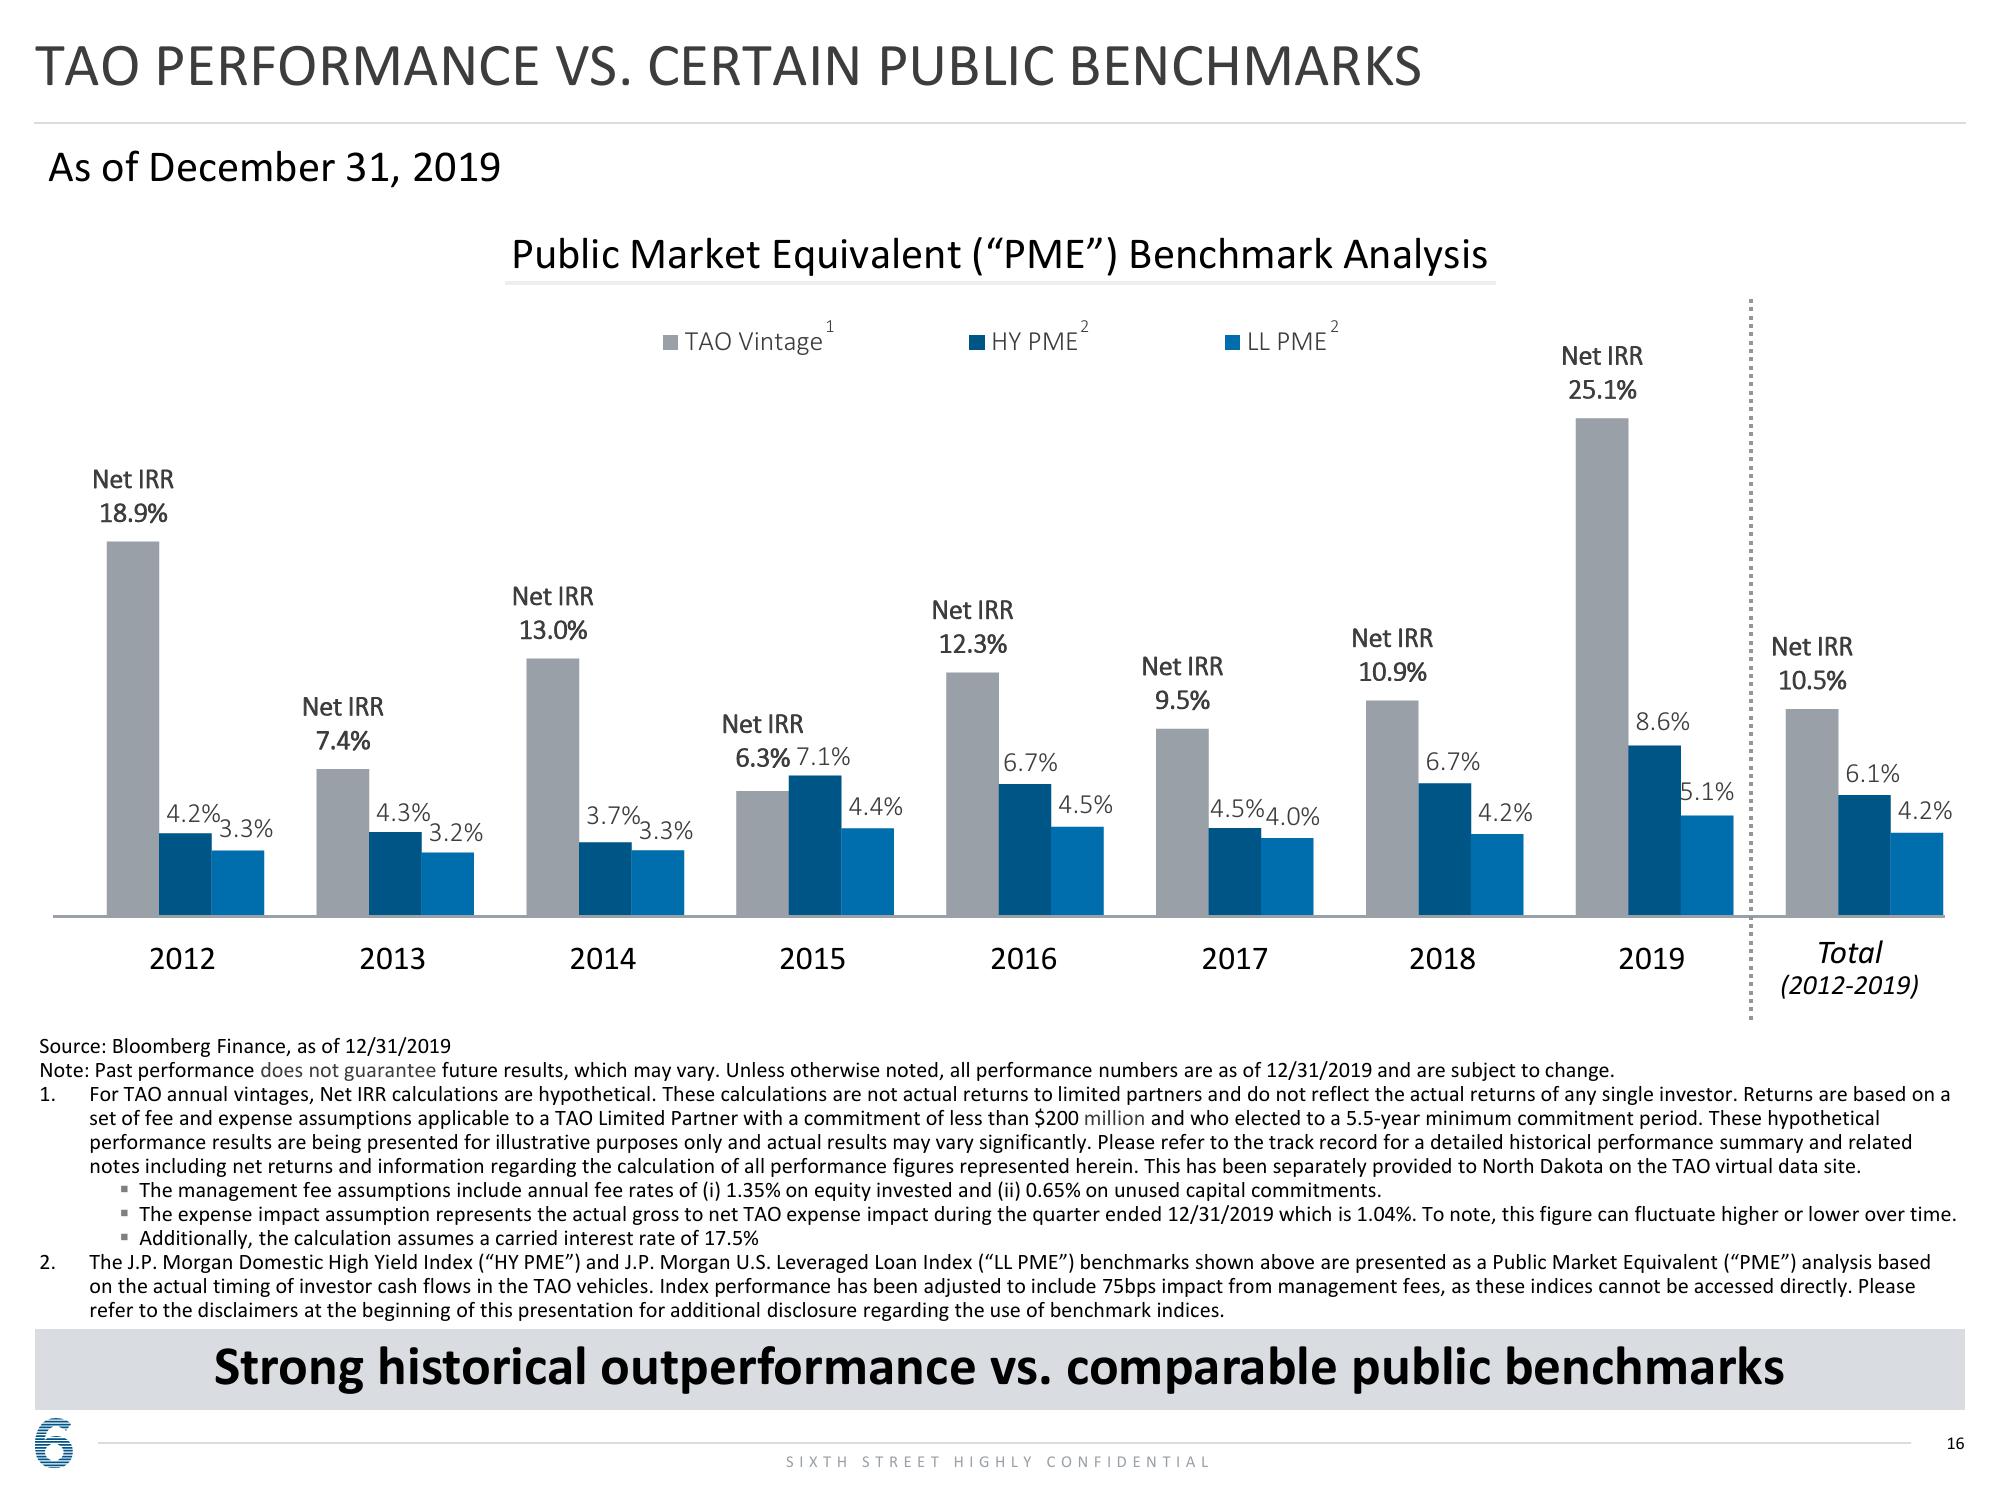
TAO PERFORMANCE VS. CERTAIN PUBLIC BENCHMARKS
As of December 31, 2019
2.
Net IRR
18.9%
6
4.2%3
2012
3.3%
Net IRR
7.4%
4.3%
2013
3.2%
Public Market Equivalent ("PME") Benchmark Analysis
Net IRR
13.0%
■TAO Vintage
3.7%3.3%
2014
Net IRR
1
6.3% 7.1%
2015
4.4%
HY PME
Net IRR
12.3%
6.7%
2
4.5%
2016
Net IRR
9.5%
☐LL PME
4.5%4.0%
2017
2
SIXTH STREET HIGHLY CONFIDENTIAL
Net IRR
10.9%
6.7%
4.2%
2018
Net IRR
25.1%
8.6%
5.1%
2019
Net IRR
10.5%
6.1%
Source: Bloomberg Finance, as of 12/31/2019
Note: Past performance does not guarantee future results, which may vary. Unless otherwise noted, all performance numbers are as of 12/31/2019 and are subject to change.
1. For TAO annual vintages, Net IRR calculations are hypothetical. These calculations are not actual returns to limited partners and do not reflect the actual returns of any single investor. Returns are based on a
set of fee and expense assumptions applicable to a TAO Limited Partner with a commitment of less than $200 million and who elected to a 5.5-year minimum commitment period. These hypothetical
performance results are being presented for illustrative purposes only and actual results may vary significantly. Please refer to the track record for a detailed historical performance summary and related
notes including net returns and information regarding the calculation of all performance figures represented herein. This has been separately provided to North Dakota on the TAO virtual data site.
▪ The management fee assumptions include annual fee rates of (i) 1.35% on equity invested and (ii) 0.65% on unused capital commitments.
▪ The expense impact assumption represents the actual gross to net TAO expense impact during the quarter ended 12/31/2019 which is 1.04%. To note, this figure can fluctuate higher or lower over time.
Additionally, the calculation assumes a carried interest rate of 17.5%
■
4.2%
Total
(2012-2019)
The J.P. Morgan Domestic High Yield Index ("HY PME") and J.P. Morgan U.S. Leveraged Loan Index ("LL PME") benchmarks shown above are presented as a Public Market Equivalent ("PME") analysis based
on the actual timing of investor cash flows in the TAO vehicles. Index performance has been adjusted to include 75bps impact from management fees, as these indices cannot be accessed directly. Please
refer to the disclaimers at the beginning of this presentation for additional disclosure regarding the use of benchmark indices.
Strong historical outperformance vs. comparable public benchmarks
16View entire presentation