Summit Hotel Properties Investor Presentation Deck
15
Urban and Weekday Demand Driving Next Phase of Lodging Recovery
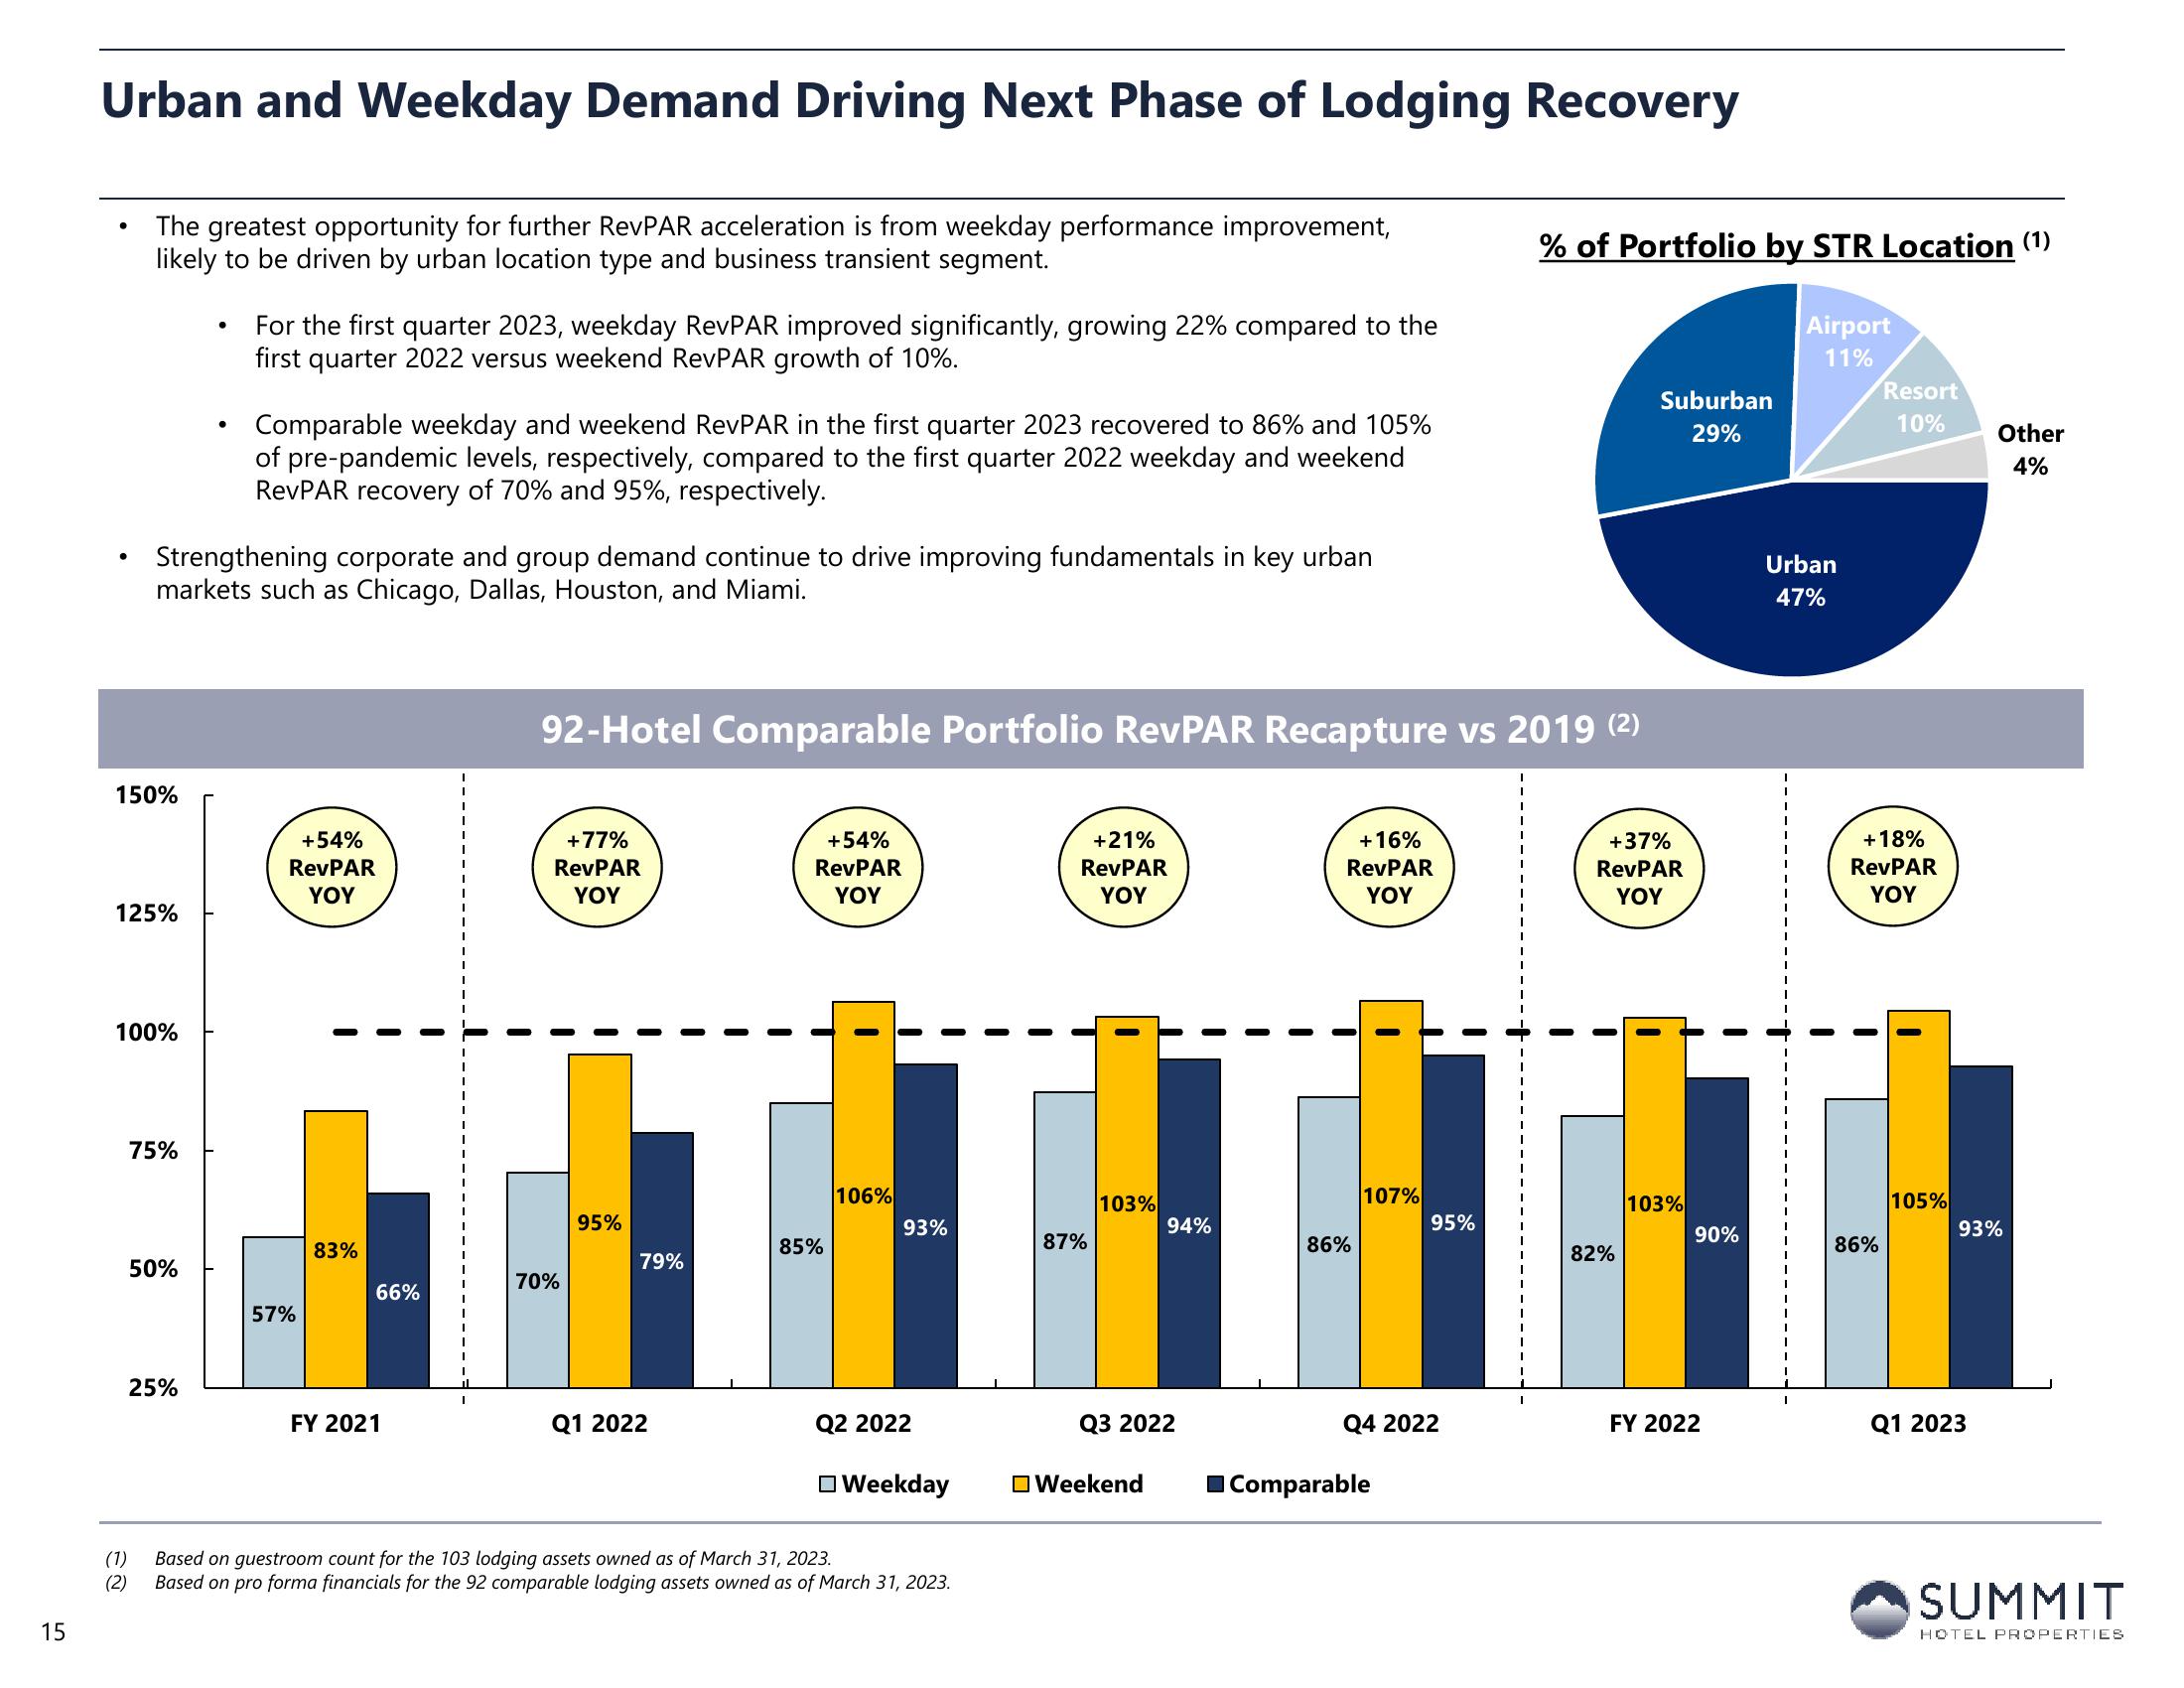
The greatest opportunity for further RevPAR acceleration is from weekday performance improvement,
likely to be driven by urban location type and business transient segment.
●
150%
125%
Strengthening corporate and group demand continue to drive improving fundamentals in key urban
markets such as Chicago, Dallas, Houston, and Miami.
100%
75%
50%
(1)
(2)
25%
For the first quarter 2023, weekday RevPAR improved significantly, growing 22% compared to the
first quarter 2022 versus weekend RevPAR growth of 10%.
Comparable weekday and weekend RevPAR in the first quarter 2023 recovered to 86% and 105%
of pre-pa emic levels, respective
ared to the first quarter 2022 weekday and weekend
RevPAR recovery of 70% and 95%, respectively.
+54%
RevPAR
YOY
57%
83%
66%
FY 2021
92-Hotel Comparable Portfolio RevPAR Recapture vs 2019 (²)
+77%
RevPAR
YOY
70%
95%
79%
Q1 2022
+54%
RevPAR
YOY
85%
106%
93%
Q2 2022
Weekday
Based on guestroom count for the 103 lodging assets owned as of March 31, 2023.
Based on pro forma financials for the 92 comparable lodging assets owned as of March 31, 2023.
+21%
RevPAR
YOY
87%
103%
94%
Q3 2022
Weekend
+16%
RevPAR
YOY
86%
107%
95%
Q4 2022
Comparable
% of Portfolio by STR Location (¹)
Airport
11%
Suburban
29%
+37%
RevPAR
YOY
82%
103%
90%
FY 2022
Urban
47%
Resort
10%
+18%
RevPAR
YOY
86%
105%
Other
4%
93%
Q1 2023
SUMMIT
HOTEL PROPERTIESView entire presentation