Q3 Performance Coatings Report
Q3 Performance Coatings Results
($ in millions)
Refinish
Industrial
Net Sales
Adjusted EBIT
% margin
$683
Q3 2020
5.2%
Financial Performance
Volume
2021
Q3
443
336
779
123
15.8 %
5.0%
2020
Price/Mix
402
281
683
134
19.6 %
Net Sales Variance
1.2%
FX
Incl. F/X
% Change
10.4 %
19.5 %
14.1%
(8.3)%
2.7%
Acq.
Excl. F/X
9.1 %
18.3 %
12.9 %
14.1%
$779
Q3 2021
Commentary
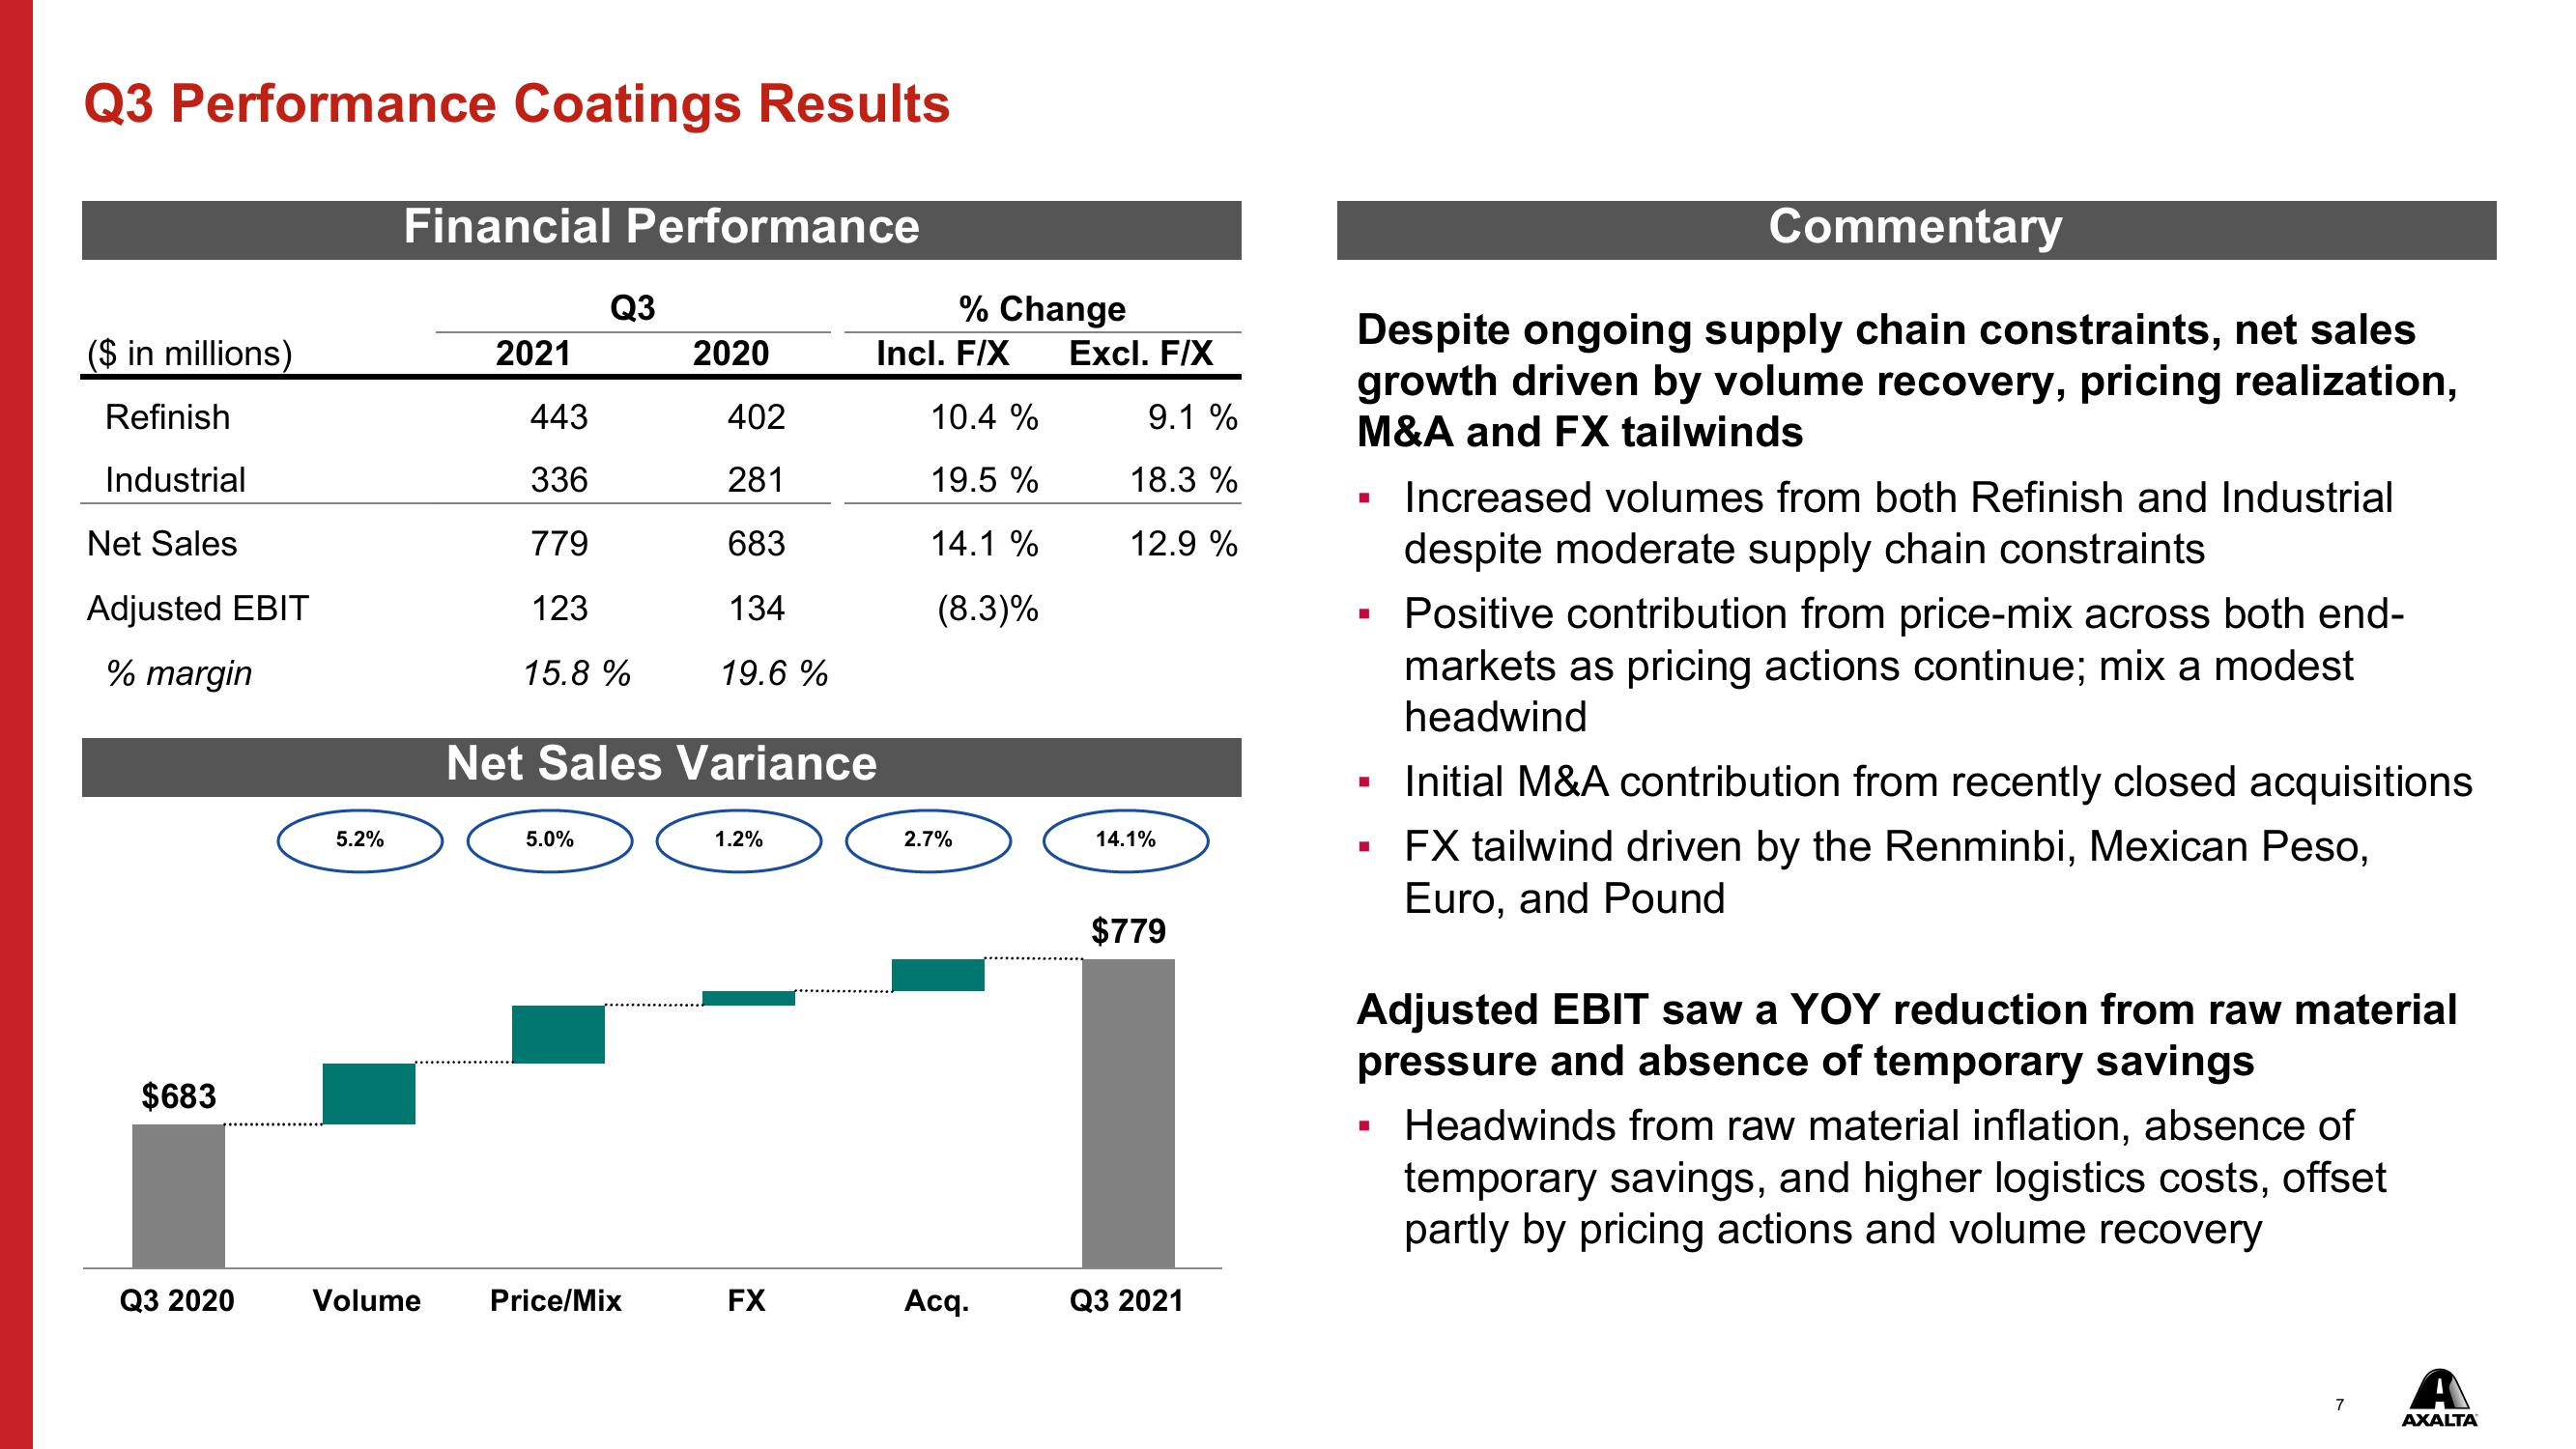
Despite ongoing supply chain constraints, net sales
growth driven by volume recovery, pricing realization,
M&A and FX tailwinds
Increased volumes from both Refinish and Industrial
despite moderate supply chain constraints
Positive contribution from price-mix across both end-
markets as pricing actions continue; mix a modest
headwind
Initial M&A contribution from recently closed acquisitions
▪ FX tailwind driven by the Renminbi, Mexican Peso,
Euro, and Pound
■
Adjusted EBIT saw a YOY reduction from raw material
pressure and absence of temporary savings
Headwinds from raw material inflation, absence of
temporary savings, and higher logistics costs, offset
partly by pricing actions and volume recovery
7
A
AXALTAView entire presentation