Main Street Capital Fixed Income Presentation Deck
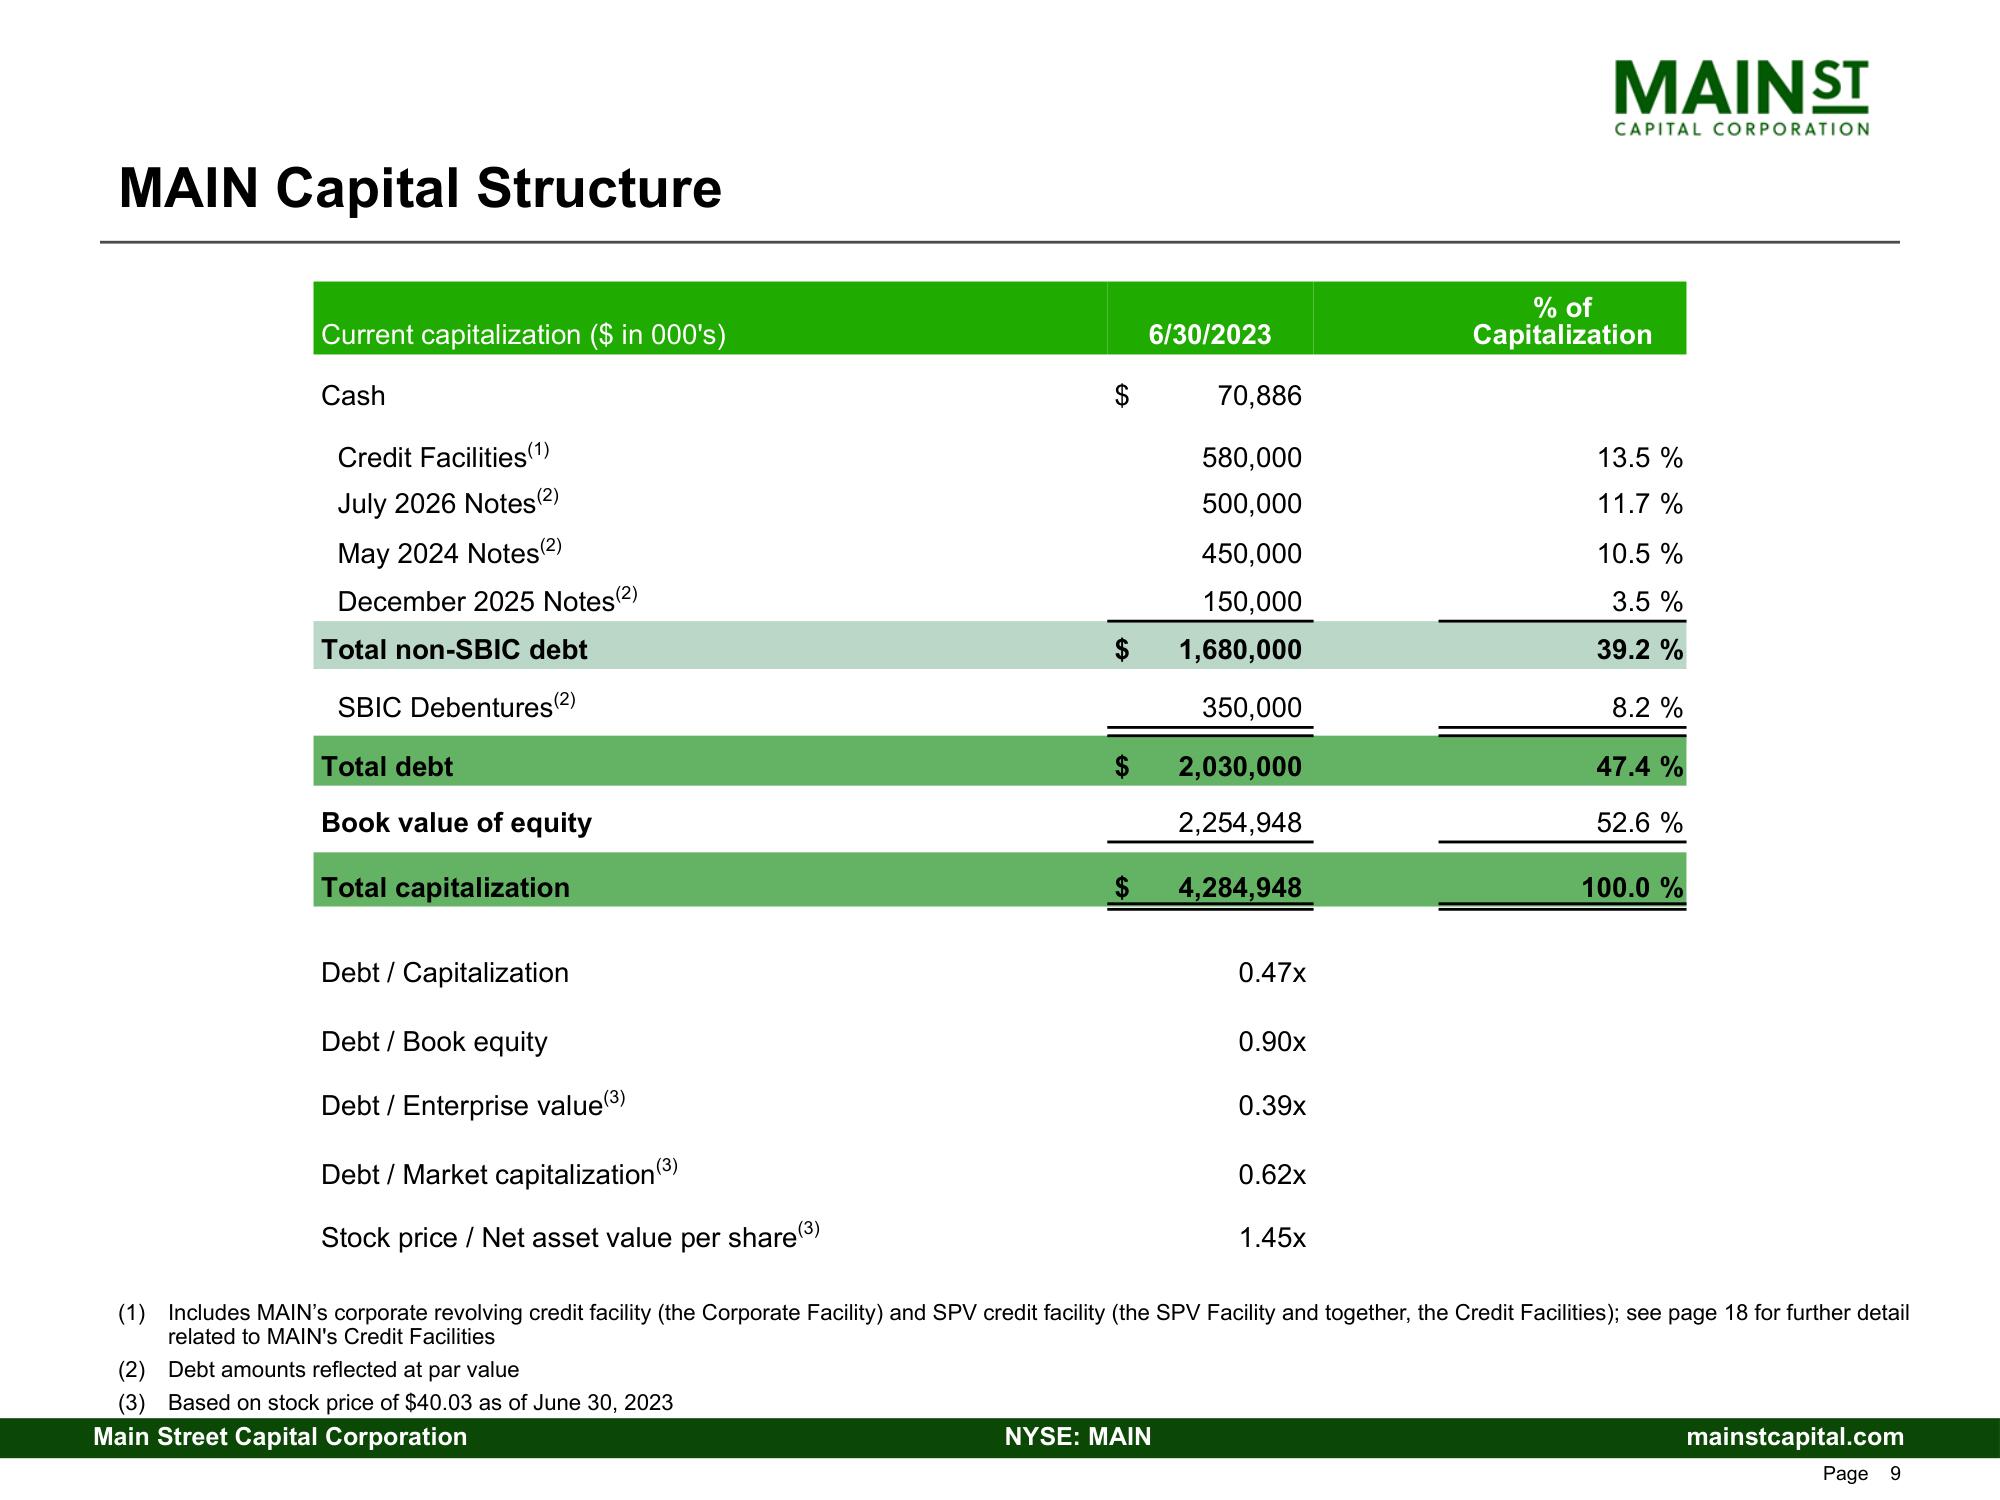
MAIN Capital Structure
Current capitalization ($ in 000's)
Cash
Credit Facilities (1)
July 2026 Notes(2)
May 2024 Notes (2)
December 2025 Notes (2)
Total non-SBIC debt
SBIC Debentures(²)
Total debt
Book value of equity
Total capitalization
Debt / Capitalization
Debt / Book equity
Debt / Enterprise value (³)
Debt / Market capitalization (3)
Stock price / Net asset value per share(³)
$
(2) Debt amounts reflected at par value
(3) Based on stock price of $40.03 as of June 30, 2023
Main Street Capital Corporation
$
SA
6/30/2023
70,886
580,000
500,000
NYSE: MAIN
450,000
150,000
1,680,000
350,000
2,030,000
2,254,948
4,284,948
0.47x
0.90x
0.39x
0.62x
1.45x
MAIN ST
CAPITAL CORPORATION
% of
Capitalization
13.5 %
11.7%
10.5 %
3.5 %
39.2 %
8.2 %
47.4 %
52.6 %
(1) Includes MAIN's corporate revolving credit facility (the Corporate Facility) and SPV credit facility (the SPV Facility and together, the Credit Facilities); see page 18 for further detail
related to MAIN's Credit Facilities
100.0 %
mainstcapital.com
Page 9View entire presentation