Jefferies Financial Group Investor Presentation Deck
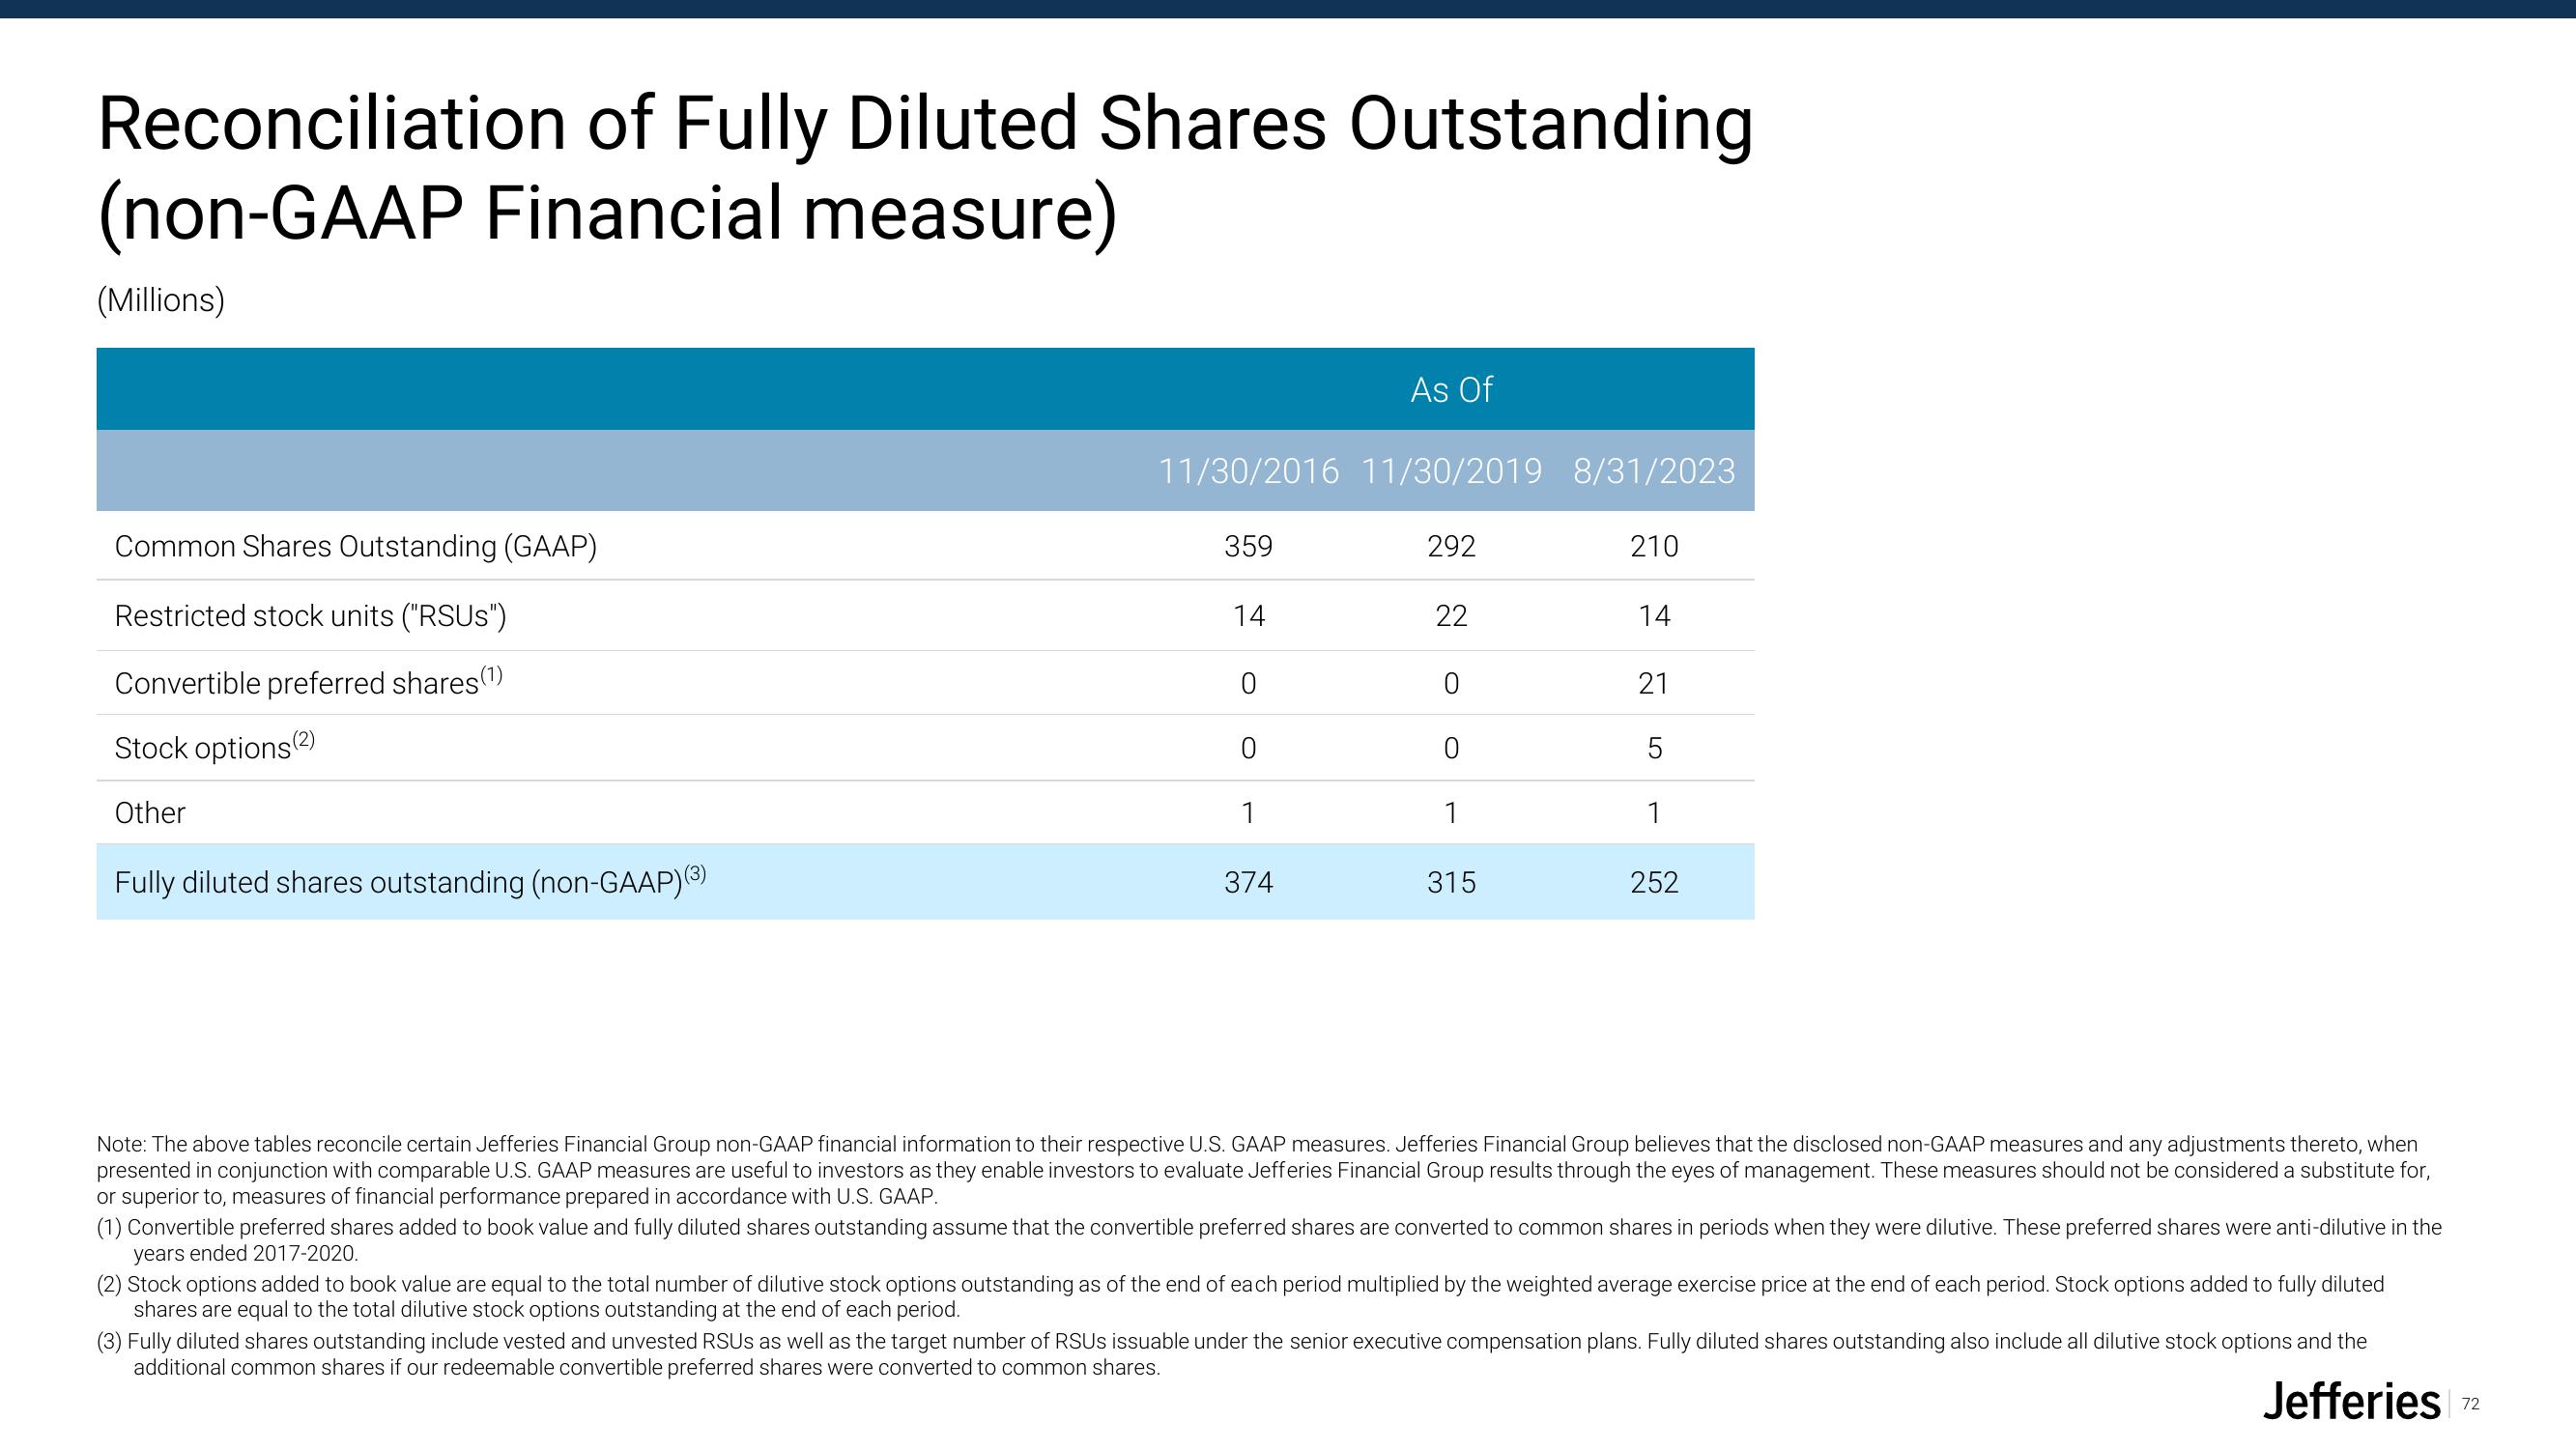
Reconciliation of Fully Diluted Shares Outstanding
(non-GAAP Financial measure)
(Millions)
Common Shares Outstanding (GAAP)
Restricted stock units ("RSUS")
Convertible preferred shares(¹)
Stock options(2)
Other
Fully diluted shares outstanding (non-GAAP) (3)
As Of
11/30/2016 11/30/2019 8/31/2023
359
292
14
22
H
0
0
0
0
1
1
315
374
210
14
21
1
252
Note: The above tables reconcile certain Jefferies Financial Group non-GAAP financial information to their respective U.S. GAAP measures. Jefferies Financial Group believes that the disclosed non-GAAP measures and any adjustments thereto, when
presented in conjunction with comparable U.S. GAAP measures are useful to investors as they enable investors to evaluate Jefferies Financial Group results through the eyes of management. These measures should not be considered a substitute for,
or superior to, measures of financial performance prepared in accordance with U.S. GAAP.
(1) Convertible preferred shares added to book value and fully diluted shares outstanding assume that the convertible preferred shares are converted to common shares in periods when they were dilutive. These preferred shares were anti-dilutive in the
years ended 2017-2020.
(2) Stock options added to book value are equal to the total number of dilutive stock options outstanding as of the end of each period multiplied by the weighted average exercise price at the end of each period. Stock options added to fully diluted
shares are equal to the total dilutive stock options outstanding at the end of each period.
(3) Fully diluted shares outstanding include vested and unvested RSUS as well as the target number of RSUS issuable under the senior executive compensation plans. Fully diluted shares outstanding also include all dilutive stock options and the
additional common shares if our redeemable convertible preferred shares were converted to common shares.
Jefferies
72View entire presentation