NewFortress Energy Results Presentation Deck
Financial Performance
Financial Performance
Operating Results
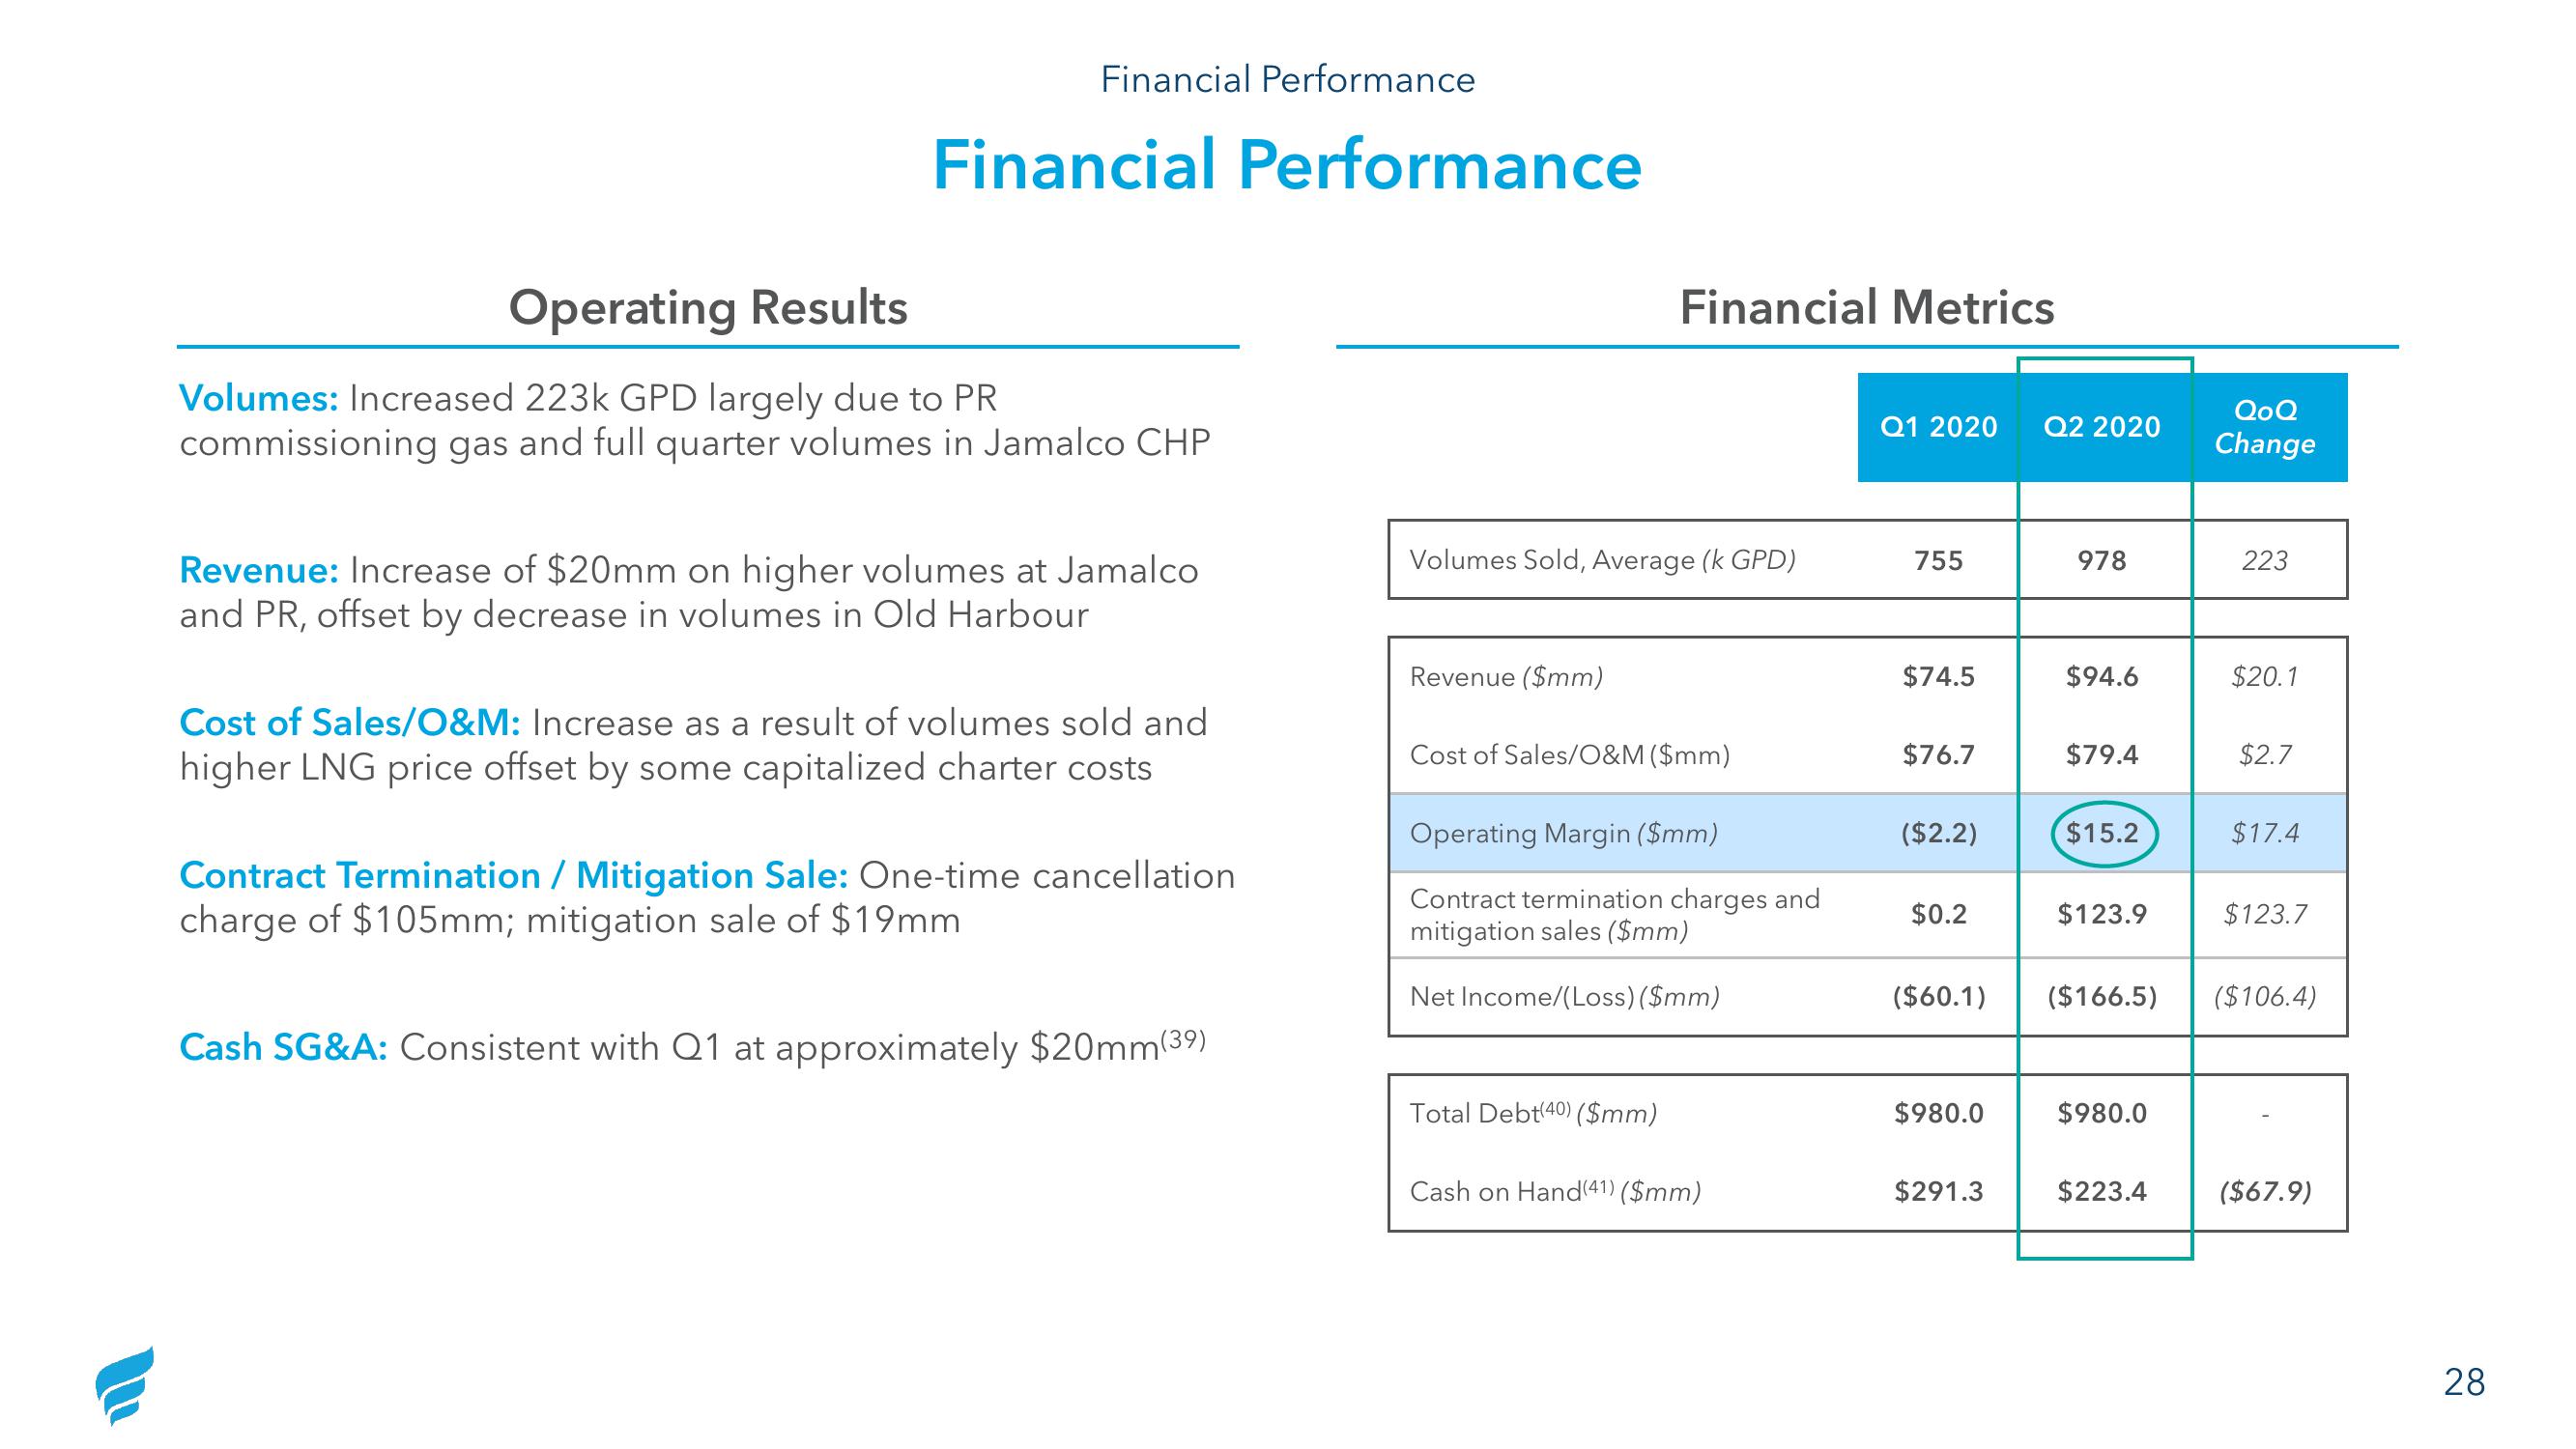
Volumes: Increased 223k GPD largely due to PR
commissioning gas and full quarter volumes in Jamalco CHP
Revenue: Increase of $20mm on higher volumes at Jamalco
and PR, offset by decrease in volumes in Old Harbour
Cost of Sales/O&M: Increase as a result of volumes sold and
higher LNG price offset by some capitalized charter costs
Contract Termination / Mitigation Sale: One-time cancellation
charge of $105mm; mitigation sale of $19mm
Cash SG&A: Consistent with Q1 at approximately $20mm(39)
Volumes Sold, Average (k GPD)
Revenue ($mm)
Financial Metrics
Cost of Sales/O&M ($mm)
Operating Margin ($mm)
Contract termination charges and
mitigation sales ($mm)
Net Income/(Loss) ($mm)
Total Debt(40) ($mm)
Cash on Hand (41) ($mm)
Q1 2020 Q2 2020
755
$74.5
$76.7
($2.2)
$0.2
($60.1)
$980.0
$291.3
978
$94.6
$79.4
$15.2
$123.9
$980.0
QoQ
Change
$223.4
223
$20.1
$2.7
$17.4
($166.5) ($106.4)
$123.7
($67.9)
28View entire presentation