Maersk Results Presentation Deck
A.P. Moller Maersk Group
- Interim Report 02 2015
APM SHIPPING
SERVICES
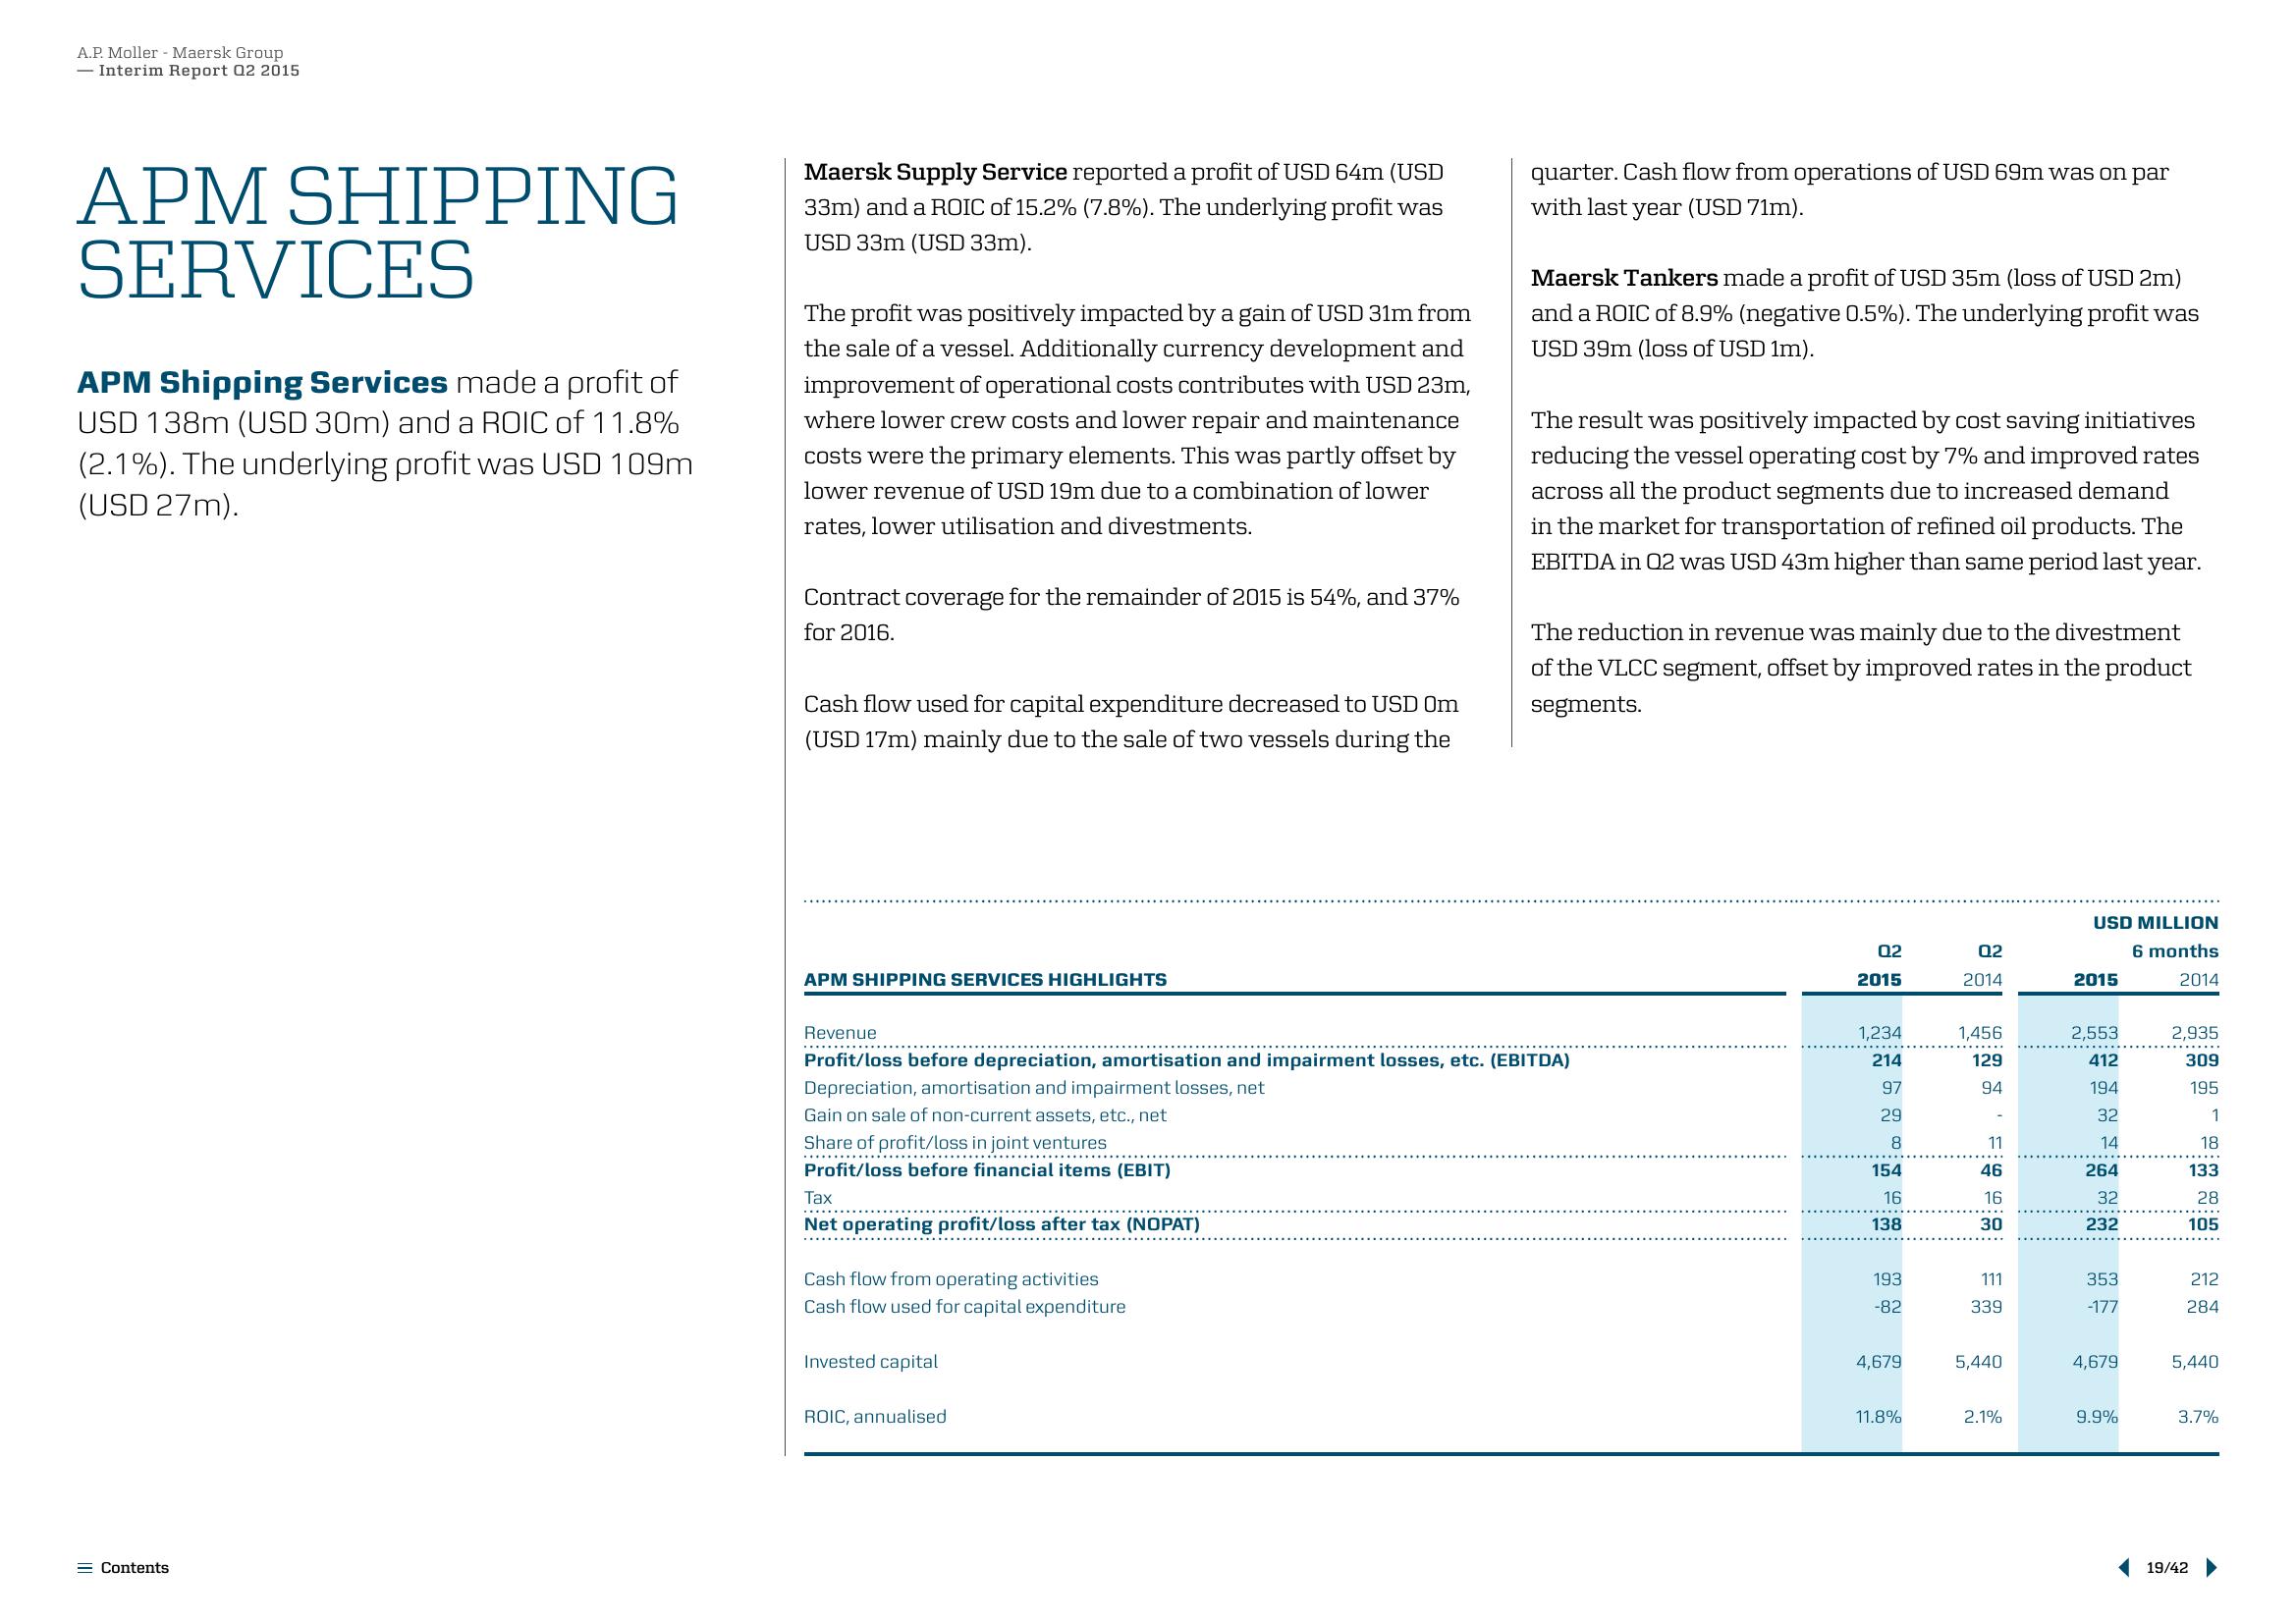
APM Shipping Services made a profit of
USD 138m (USD 30m) and a ROIC of 11.8%
(2.1%). The underlying profit was USD 109m
(USD 27m).
Contents
Maersk Supply Service reported a profit of USD 64m (USD
33m) and a ROIC of 15.2% (7.8%). The underlying profit was
USD 33m (USD 33m).
The profit was positively impacted by a gain of USD 31m from
the sale of a vessel. Additionally currency development and
improvement of operational costs contributes with USD 23m,
where lower crew costs and lower repair and maintenance
costs were the primary elements. This was partly offset by
lower revenue of USD 19m due to a combination of lower
rates, lower utilisation and divestments.
Contract coverage for the remainder of 2015 is 54%, and 37%
for 2016.
Cash flow used for capital expenditure decreased to USD Om
(USD 17m) mainly due to the sale of two vessels during the
APM SHIPPING SERVICES HIGHLIGHTS
.…….…….….…..….
Tax
Net operating profit/loss after tax (NOPAT)
Cash flow from operating activities
Cash flow used for capital expenditure
Revenue
Profit/loss before depreciation, amortisation and impairment losses, etc. (EBITDA)
Depreciation, amortisation and impairment losses, net
Gain on sale of non-current assets, etc., net
Share of profit/loss in joint ventures
Profit/loss before financial items (EBIT)
Invested capital
quarter. Cash flow from operations of USD 69m was on par
with last year (USD 71m).
ROIC, annualised
Maersk Tankers made a profit of USD 35m (loss of USD 2m)
and a ROIC of 8.9% (negative 0.5%). The underlying profit was
USD 39m (loss of USD 1m).
The result was positively impacted by cost saving initiatives
reducing the vessel operating cost by 7% and improved rates
across all the product segments due to increased demand
in the market for transportation of refined oil products. The
EBITDA in Q2 was USD 43m higher than same period last year.
The reduction in revenue was mainly due to the divestment
of the VLCC segment, offset by improved rates in the product
segments.
02
2015
1,234
214
97
29
8
154
16
138
193
-82
4,679
11.8%
02
2014
1,456
129
94
11
46
16
30
111
339
5,440
2.1%
USD MILLION
6 months
2014
2015
2,553
412
194
32
14
264
32
232
353
-177
4,679
9.9%
2,935
309
195
1
18
133
28
105
212
284
5,440
3.7%
19/42View entire presentation