IBEX Investor Presentation Deck slide image

IBEX Investor Presentation Deck

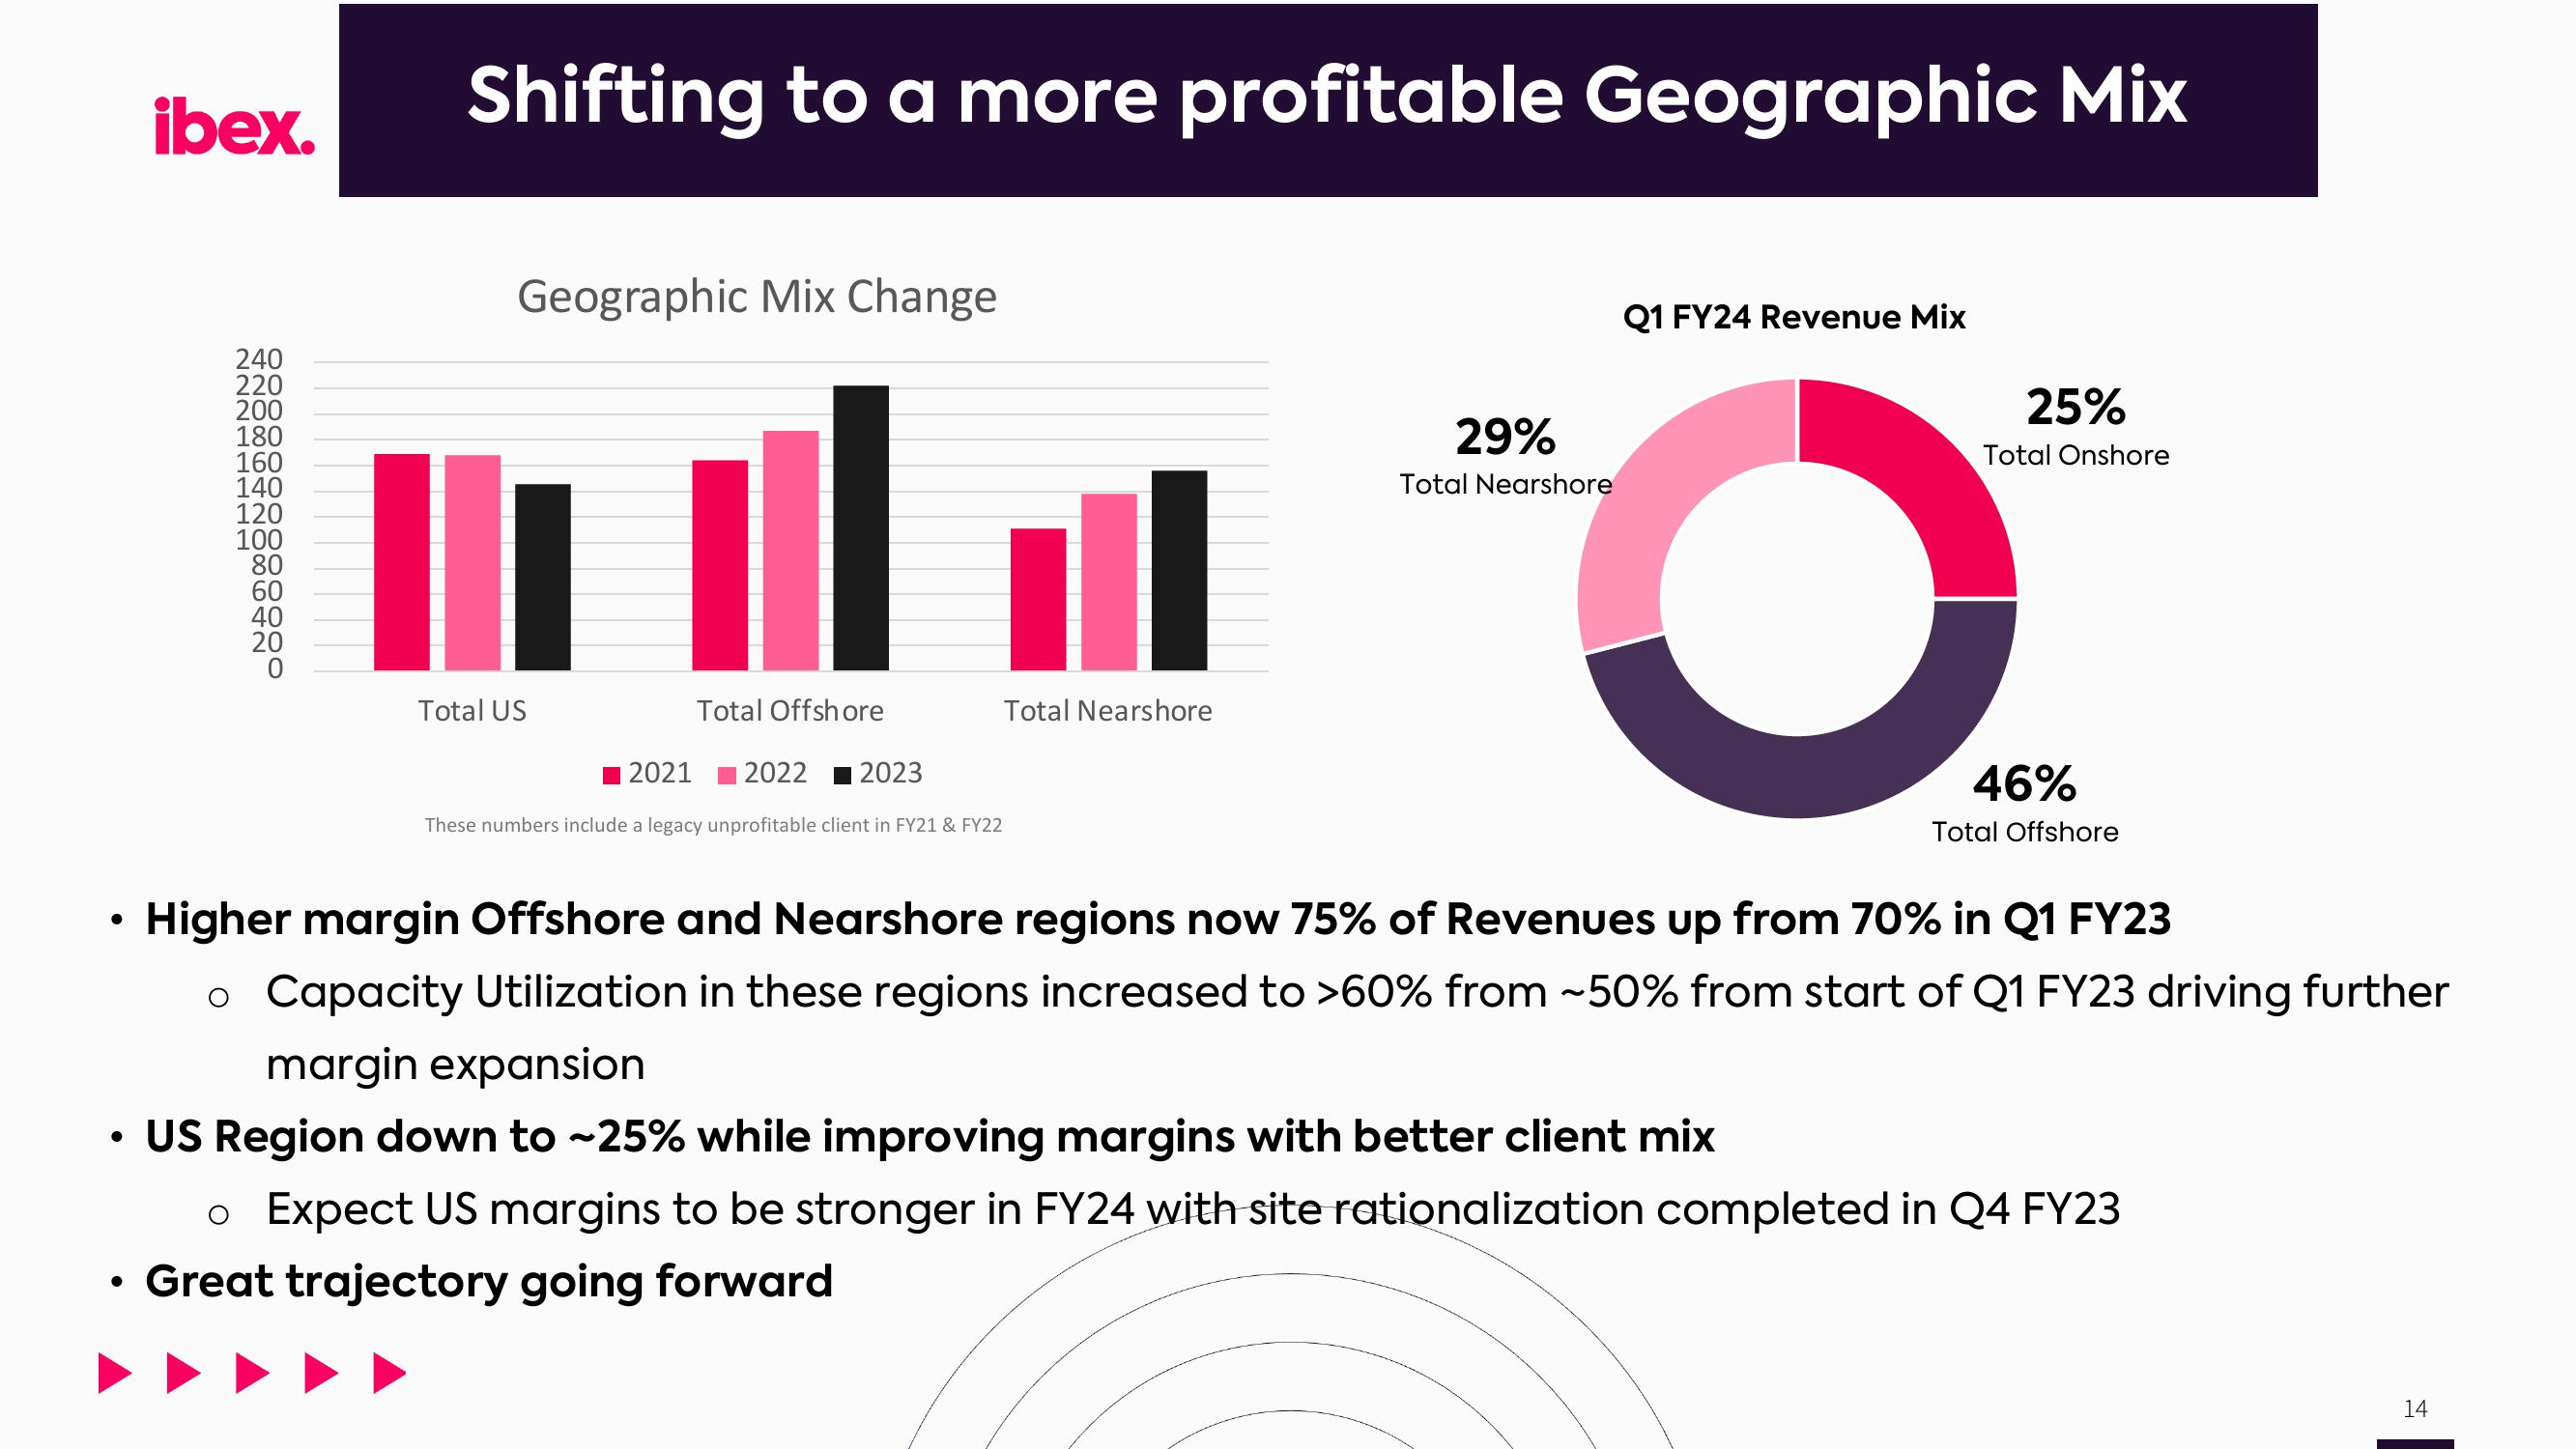
● ibex. 240 220 200 180 160 140 120 100 80 60 40 20 Shifting to a more profitable Geographic Mix Geographic Mix Change Total US Total Offshore 2021 2022 2023 These numbers include a legacy unprofitable client in FY21 & FY22 Total Nearshore Q1 FY24 Revenue Mix 29% Total Nearshore O 25% Total Onshore 46% Total Offshore Higher margin Offshore and Nearshore regions now 75% of Revenues up from 70% in Q1 FY23 o Capacity Utilization in these regions increased to >60% from ~50% from start of Q1 FY23 driving further margin expansion US Region down to ~25% while improving margins with better client mix o Expect US margins to be stronger in FY24 with site rationalization completed in Q4 FY23 Great trajectory going forward 14
View entire presentation