AMC Investor Presentation Deck
Appendix
amc
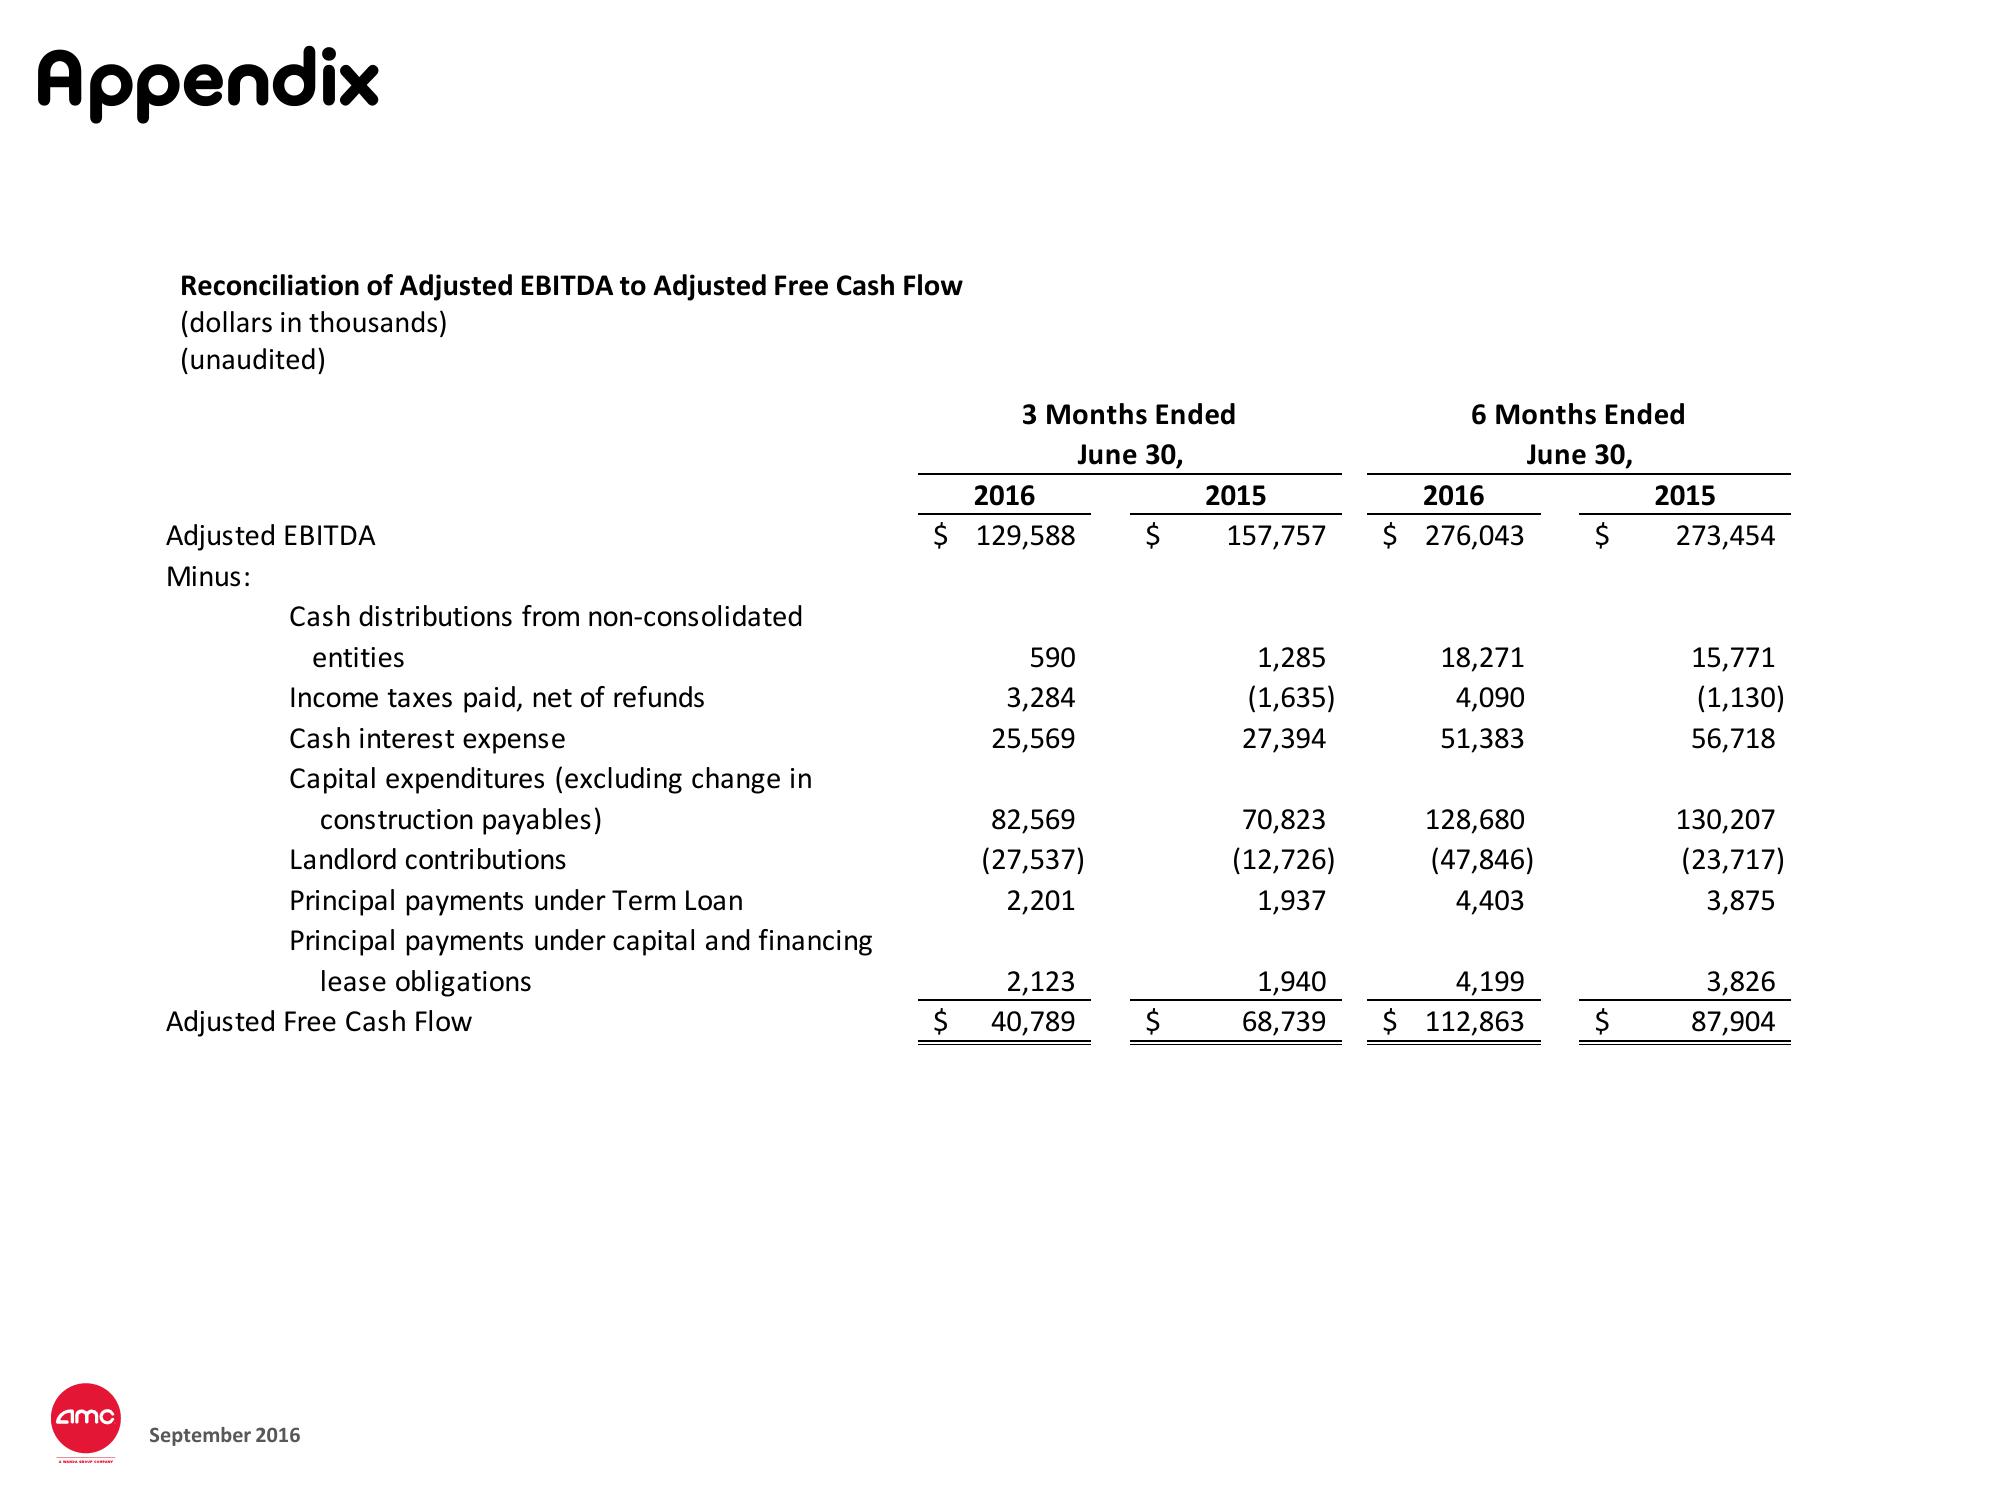
Reconciliation of Adjusted EBITDA to Adjusted Free Cash Flow
(dollars in thousands)
(unaudited)
Adjusted EBITDA
Minus:
Cash distributions from non-consolidated
entities
Income taxes paid, net of refunds
Cash interest expense
Capital expenditures (excluding change in
construction payables)
Landlord contributions
Principal payments under Term Loan
Principal payments under capital and financing
lease obligations
Adjusted Free Cash Flow
September 2016
3 Months Ended
June 30,
2016
$ 129,588
$
590
3,284
25,569
82,569
(27,537)
2,201
2,123
40,789
$
$
2015
157,757
1,285
(1,635)
27,394
70,823
(12,726)
1,937
1,940
68,739
6 Months Ended
June 30,
2016
$ 276,043
18,271
4,090
51,383
128,680
(47,846)
4,403
4,199
$ 112,863
$
$
2015
273,454
15,771
(1,130)
56,718
130,207
(23,717)
3,875
3,826
87,904View entire presentation