Acast Results Presentation Deck
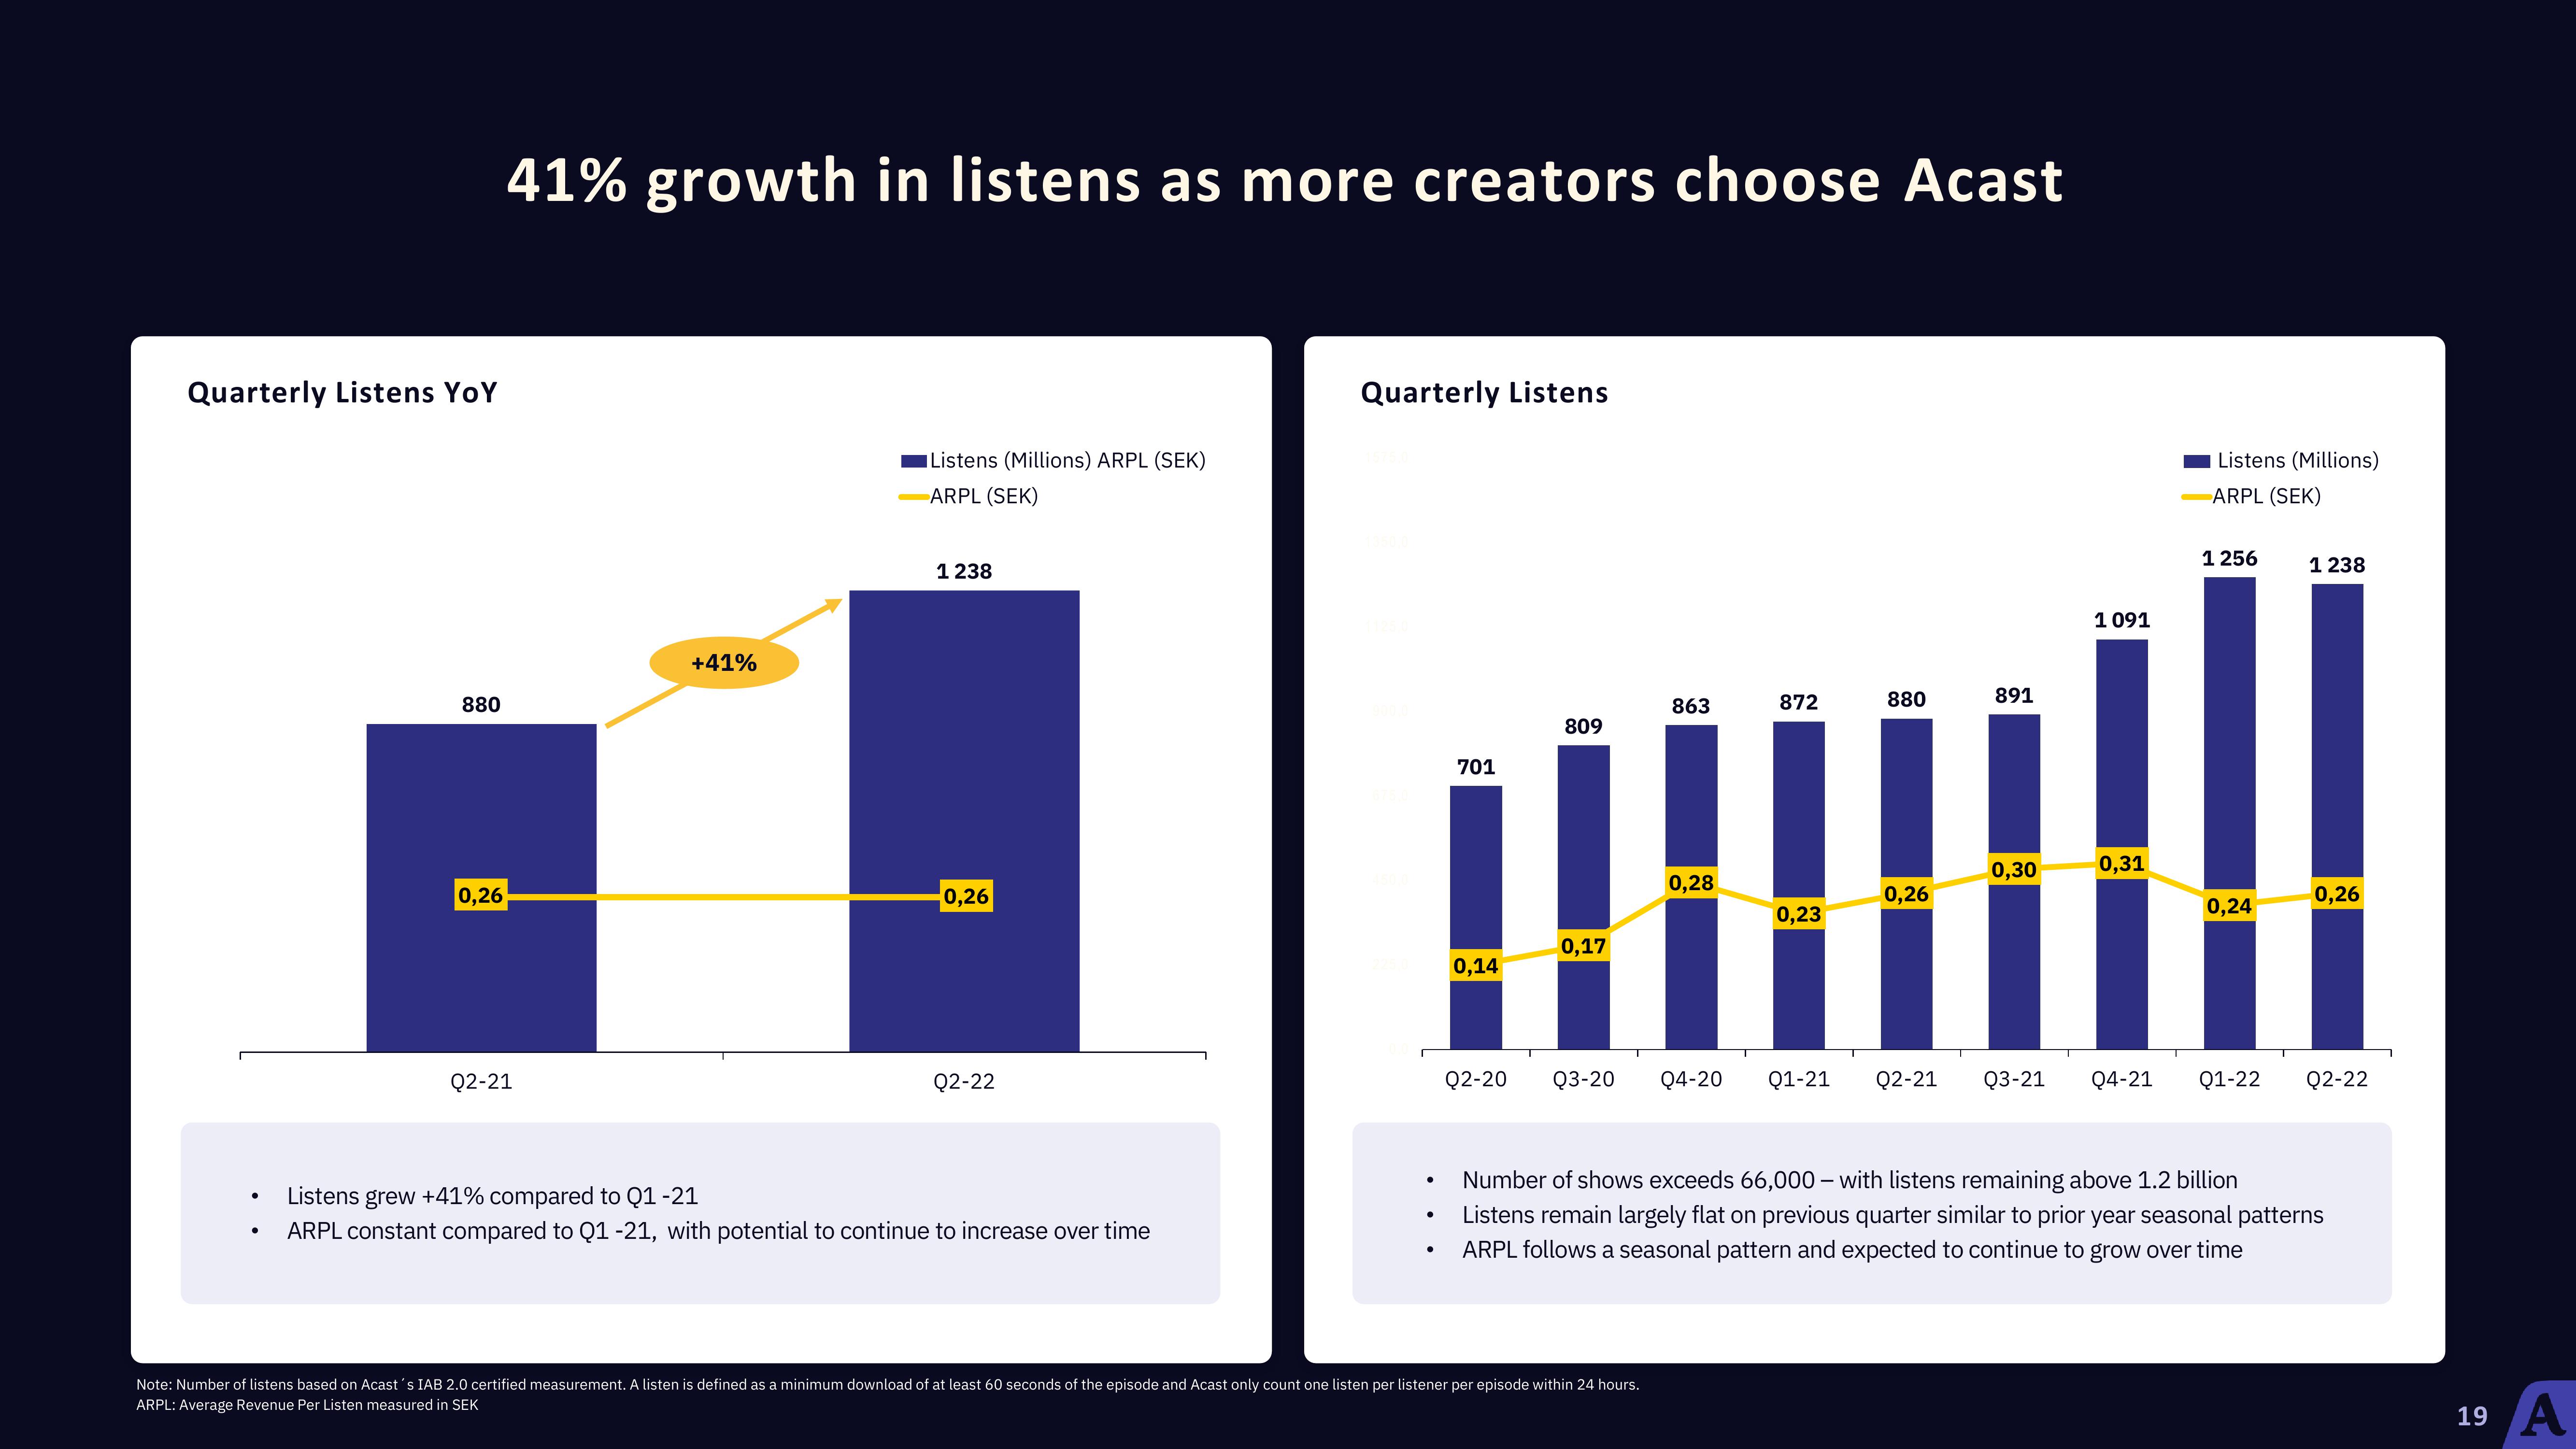
Quarterly Listens YoY
880
0,26
41% growth in listens as more creators choose Acast
Q2-21
+41%
Listens (Millions) ARPL (SEK)
ARPL (SEK)
1 238
0,26
Q2-22
Listens grew +41% compared to Q1 -21
ARPL constant compared to Q1 -21, with potential to continue to increase over time
Quarterly Listens
.
701
0.14
Q2-20
809
0,17
863
0,28
Note: Number of listens based on Acast's IAB 2.0 certified measurement. A listen is defined as a minimum download of at least 60 seconds of the episode and Acast only count one listen per listener per episode within 24 hours.
ARPL: Average Revenue Per Listen measured in SEK
872
0,23
880
0,26
891
0,30
1091
0,31
Listens (Millions)
ARPL (SEK)
1 256
0,24
Q3-20 Q4-20 Q1-21 Q2-21 Q3-21 Q4-21 Q1-22
1 238
0,26
Q2-22
Number of shows exceeds 66,000 - with listens remaining above 1.2 billion
Listens remain largely flat on previous quarter similar to prior year seasonal patterns
ARPL follows a seasonal pattern and expected to continue to grow over time
19 AView entire presentation