Embracer Group Results Presentation Deck
FINANCIAL PERFORMANCE | Q1
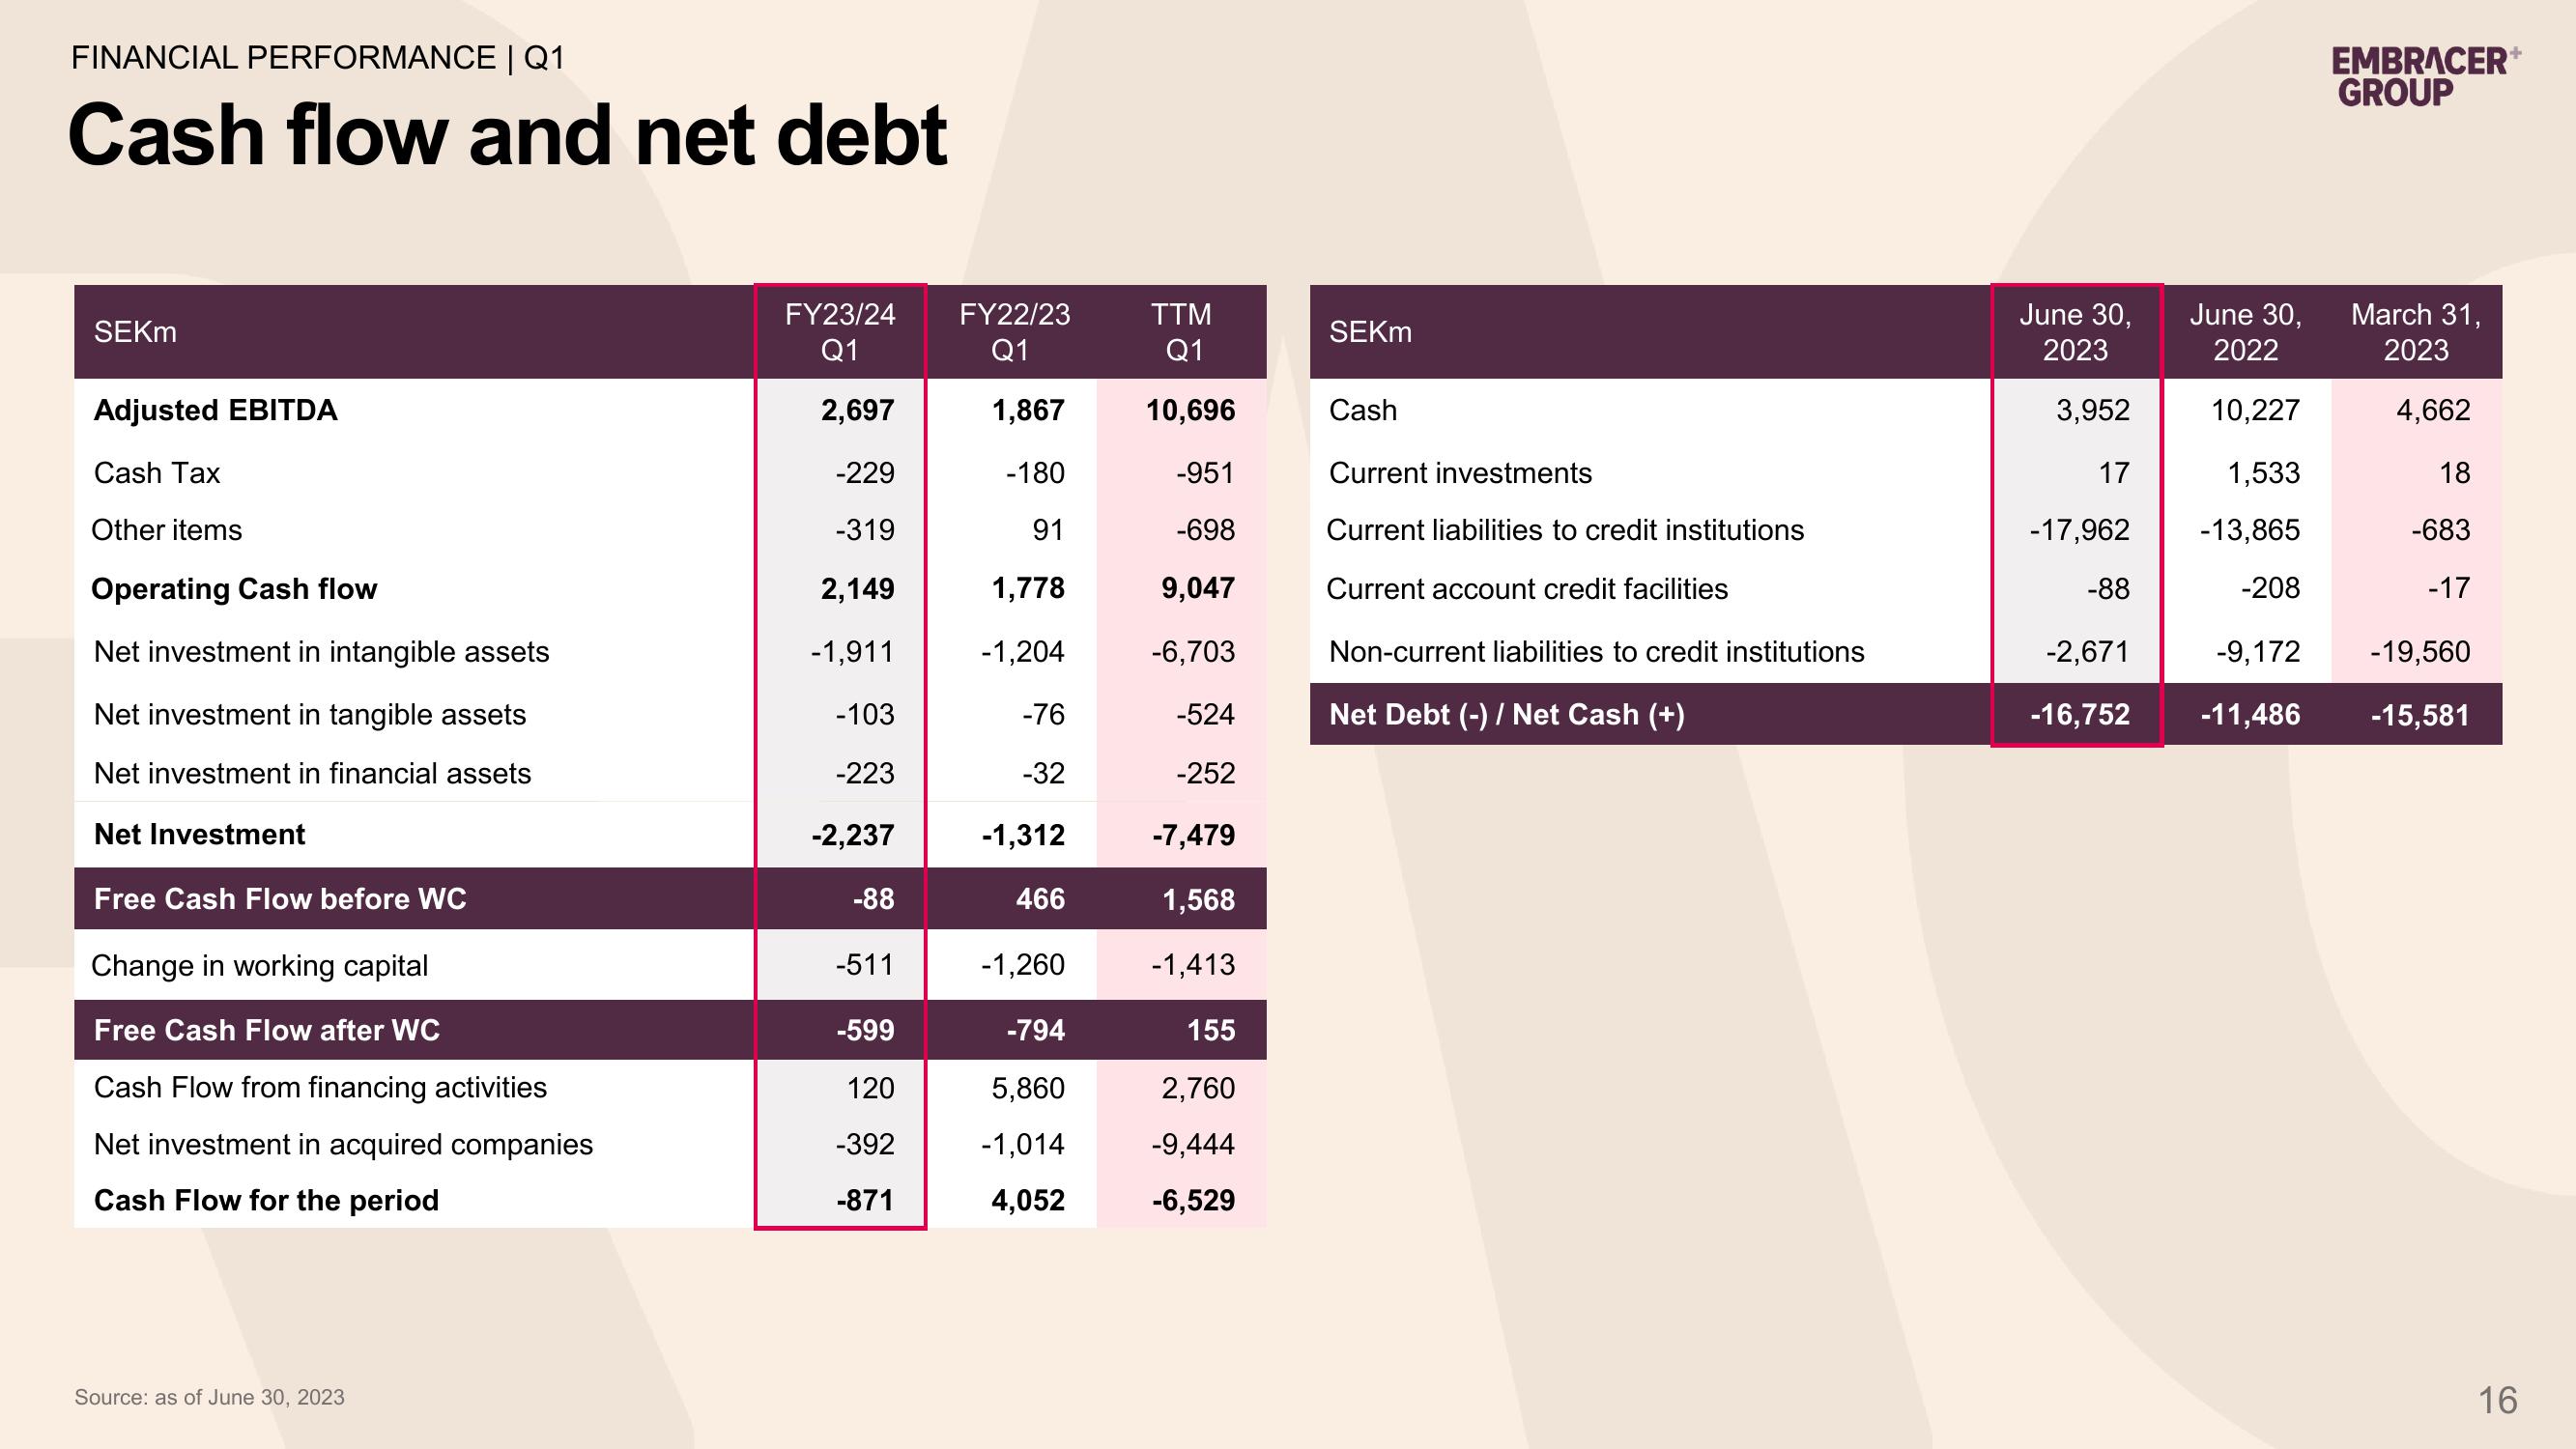
Cash flow and net debt
SEKM
Adjusted EBITDA
Cash Tax
Other items
Operating Cash flow
Net investment in intangible assets
Net investment in tangible assets
Net investment in financial assets
Net Investment
Free Cash Flow before WC
Change in working capital
Free Cash Flow after WC
Cash Flow from financing activities
Net investment in acquired companies
Cash Flow for the period
Source: as of June 30, 2023
FY23/24
Q1
2,697
-229
-319
2,149
-1,911
-103
-223
-2,237
-88
-511
-599
120
-392
-871
FY22/23
Q1
1,867
-180
91
1,778
-1,204
-76
-32
-1,312
466
-1,260
-794
5,860
-1,014
4,052
TTM
Q1
10,696
-951
-698
9,047
-6,703
-524
-252
-7,479
1,568
-1,413
155
2,760
-9,444
-6,529
SEKM
Cash
Current investments
Current liabilities to credit institutions
Current account credit facilities
Non-current liabilities to credit institutions
Net Debt (-) / Net Cash (+)
June 30,
2023
3,952
17
-17,962
-88
June 30,
2022
10,227
1,533
-13,865
-208
EMBRACER+
GROUP
March 31,
2023
4,662
18
-683
-17
-2,671 -9,172 -19,560
-16,752 -11,486 -15,581
16View entire presentation