Circut Results Presentation Deck
2022 dynamics
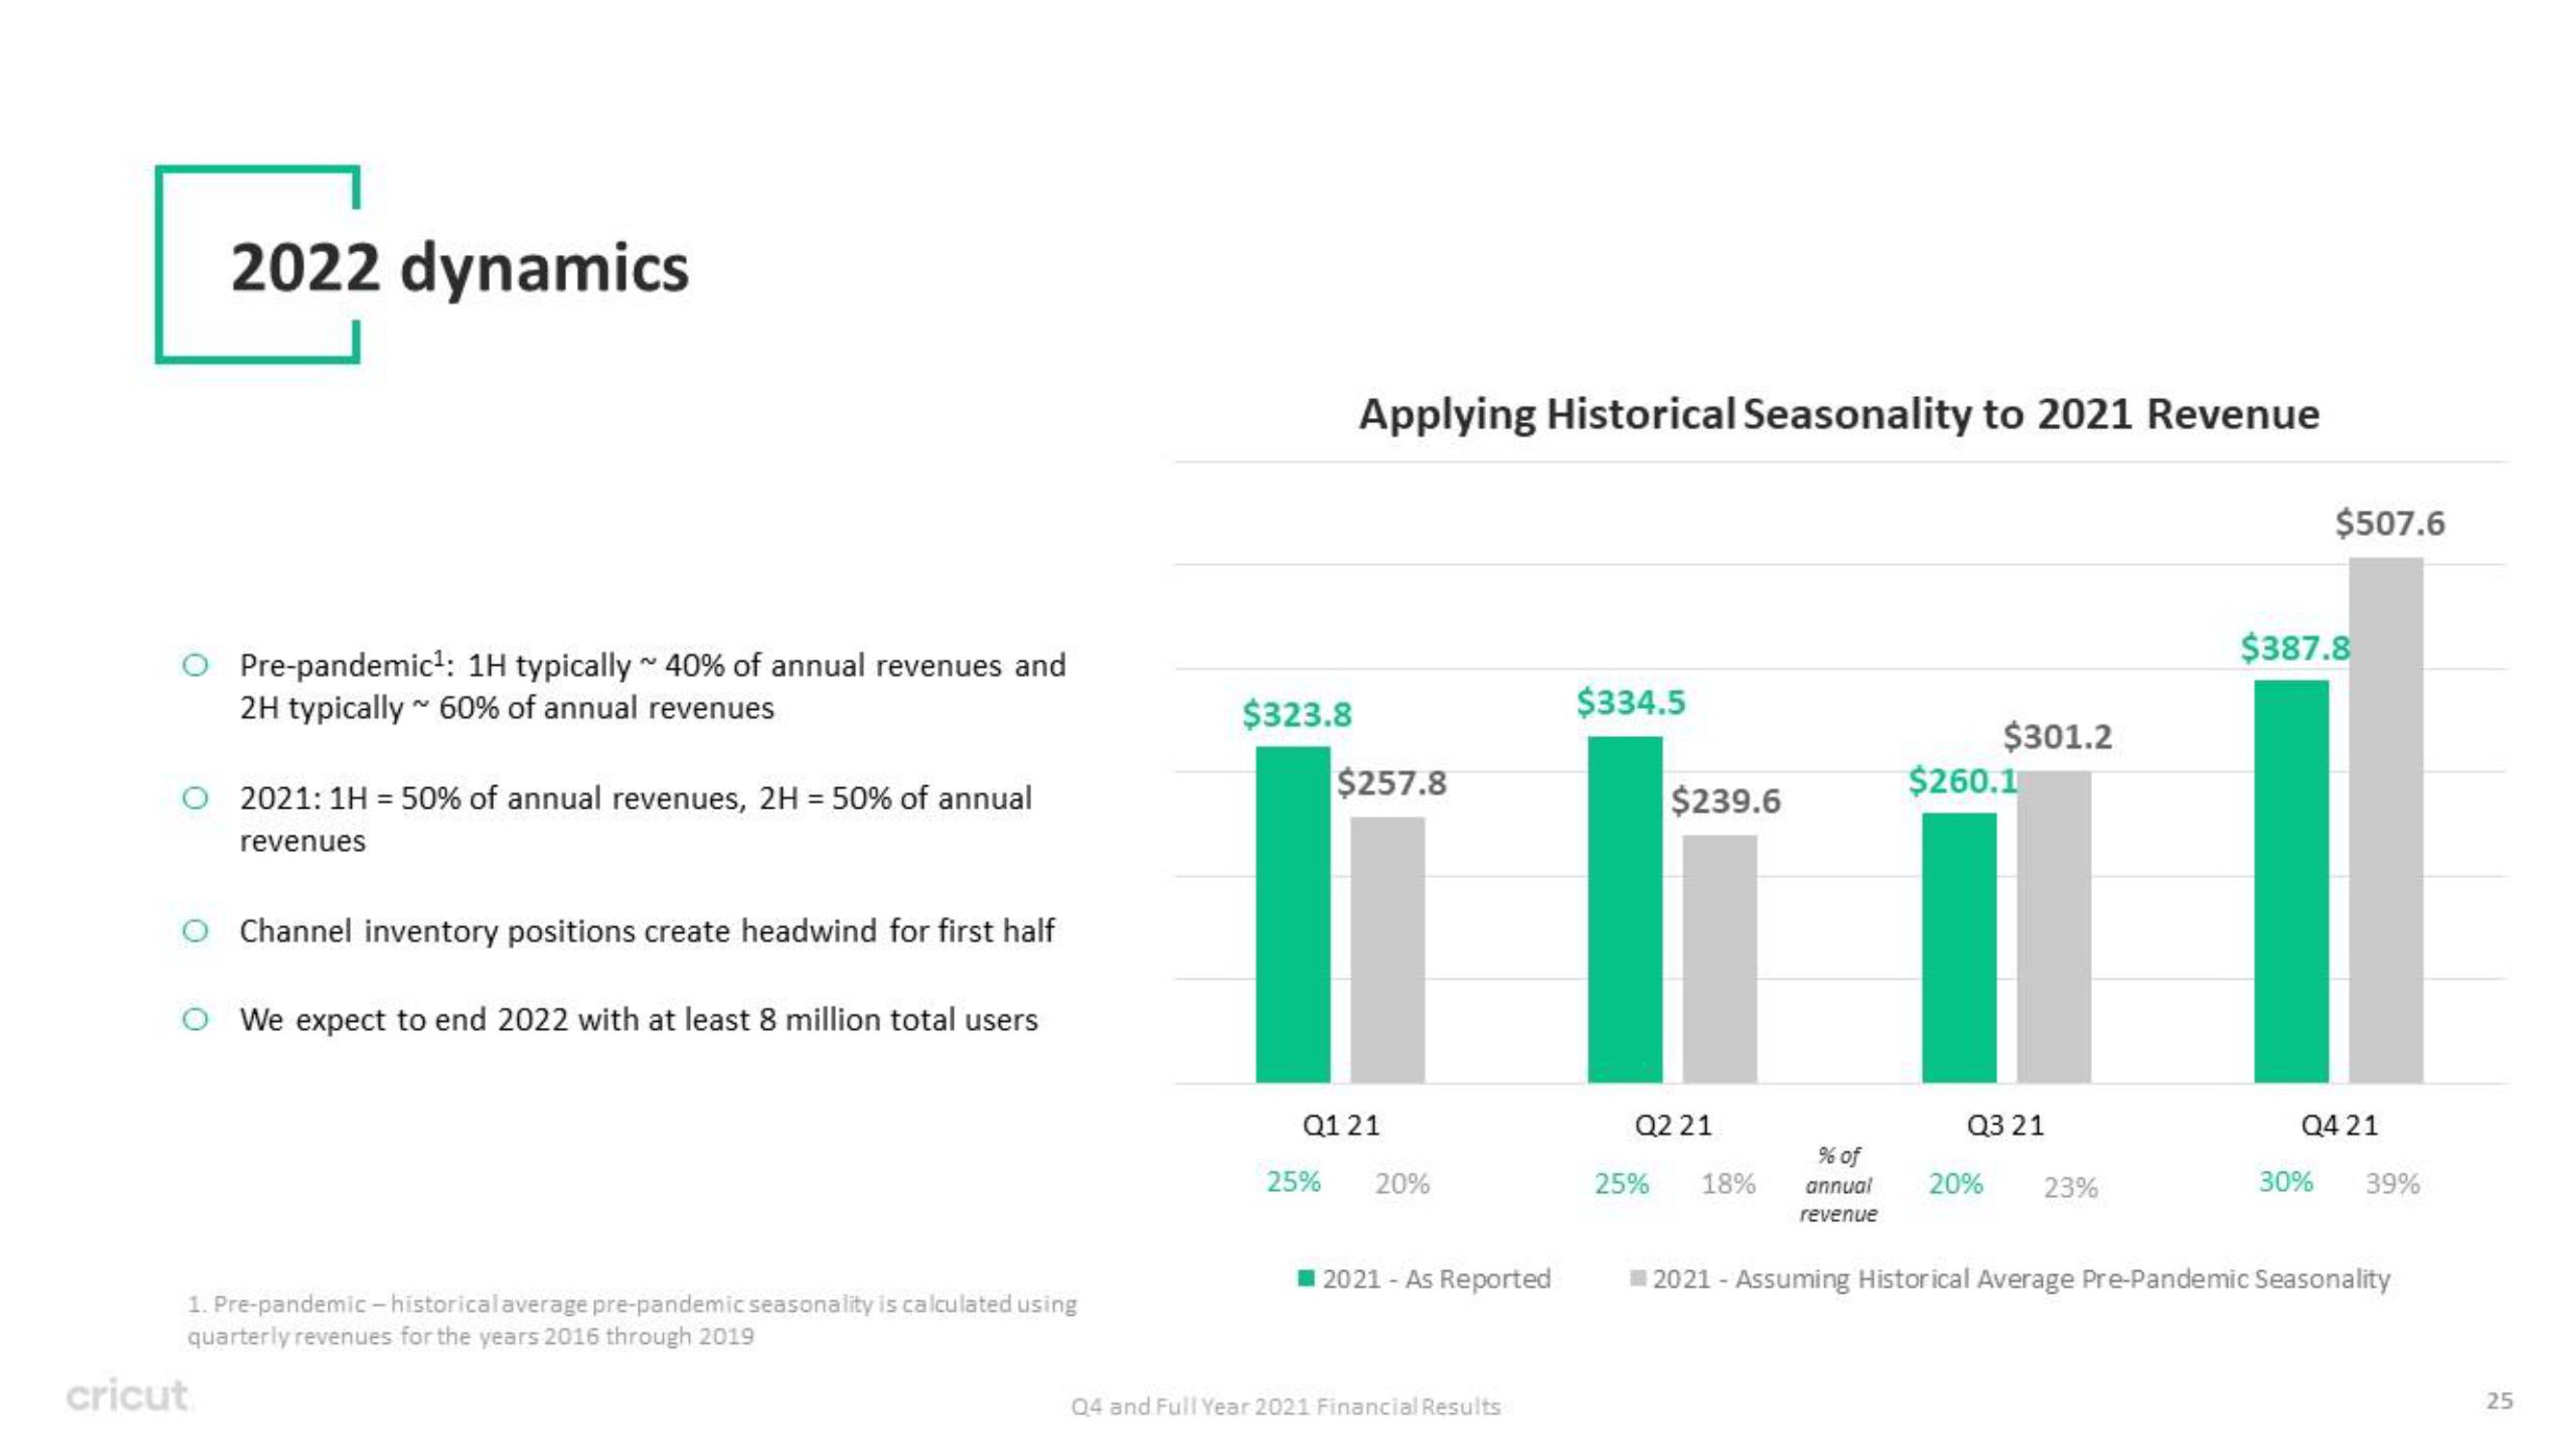
Pre-pandemic¹: 1H typically~ 40% of annual revenues and
2H typically ~ 60% of annual revenues
cricut
2021: 1H = 50% of annual revenues, 2H = 50% of annual
revenues
Channel inventory positions create headwind for first half
O We expect to end 2022 with at least 8 million total users
1. Pre-pandemic-historical average pre-pandemic seasonality is calculated using
quarterly revenues for the years 2016 through 2019
$323.8
Applying Historical Seasonality to 2021 Revenue
$257.8
Q1 21
25% 20%
2021 - As Reported
04 and Full Year 2021 Financial Results
$334.5
$239.6
Q2 21
25%
18%
% of
annual
revenue
$301.2
$260.1
Q3 21
20%
23%
$507.6
$387.8
Q4 21
30% 39%
2021 - Assuming Historical Average Pre-Pandemic Seasonality
25View entire presentation