TPG Results Presentation Deck
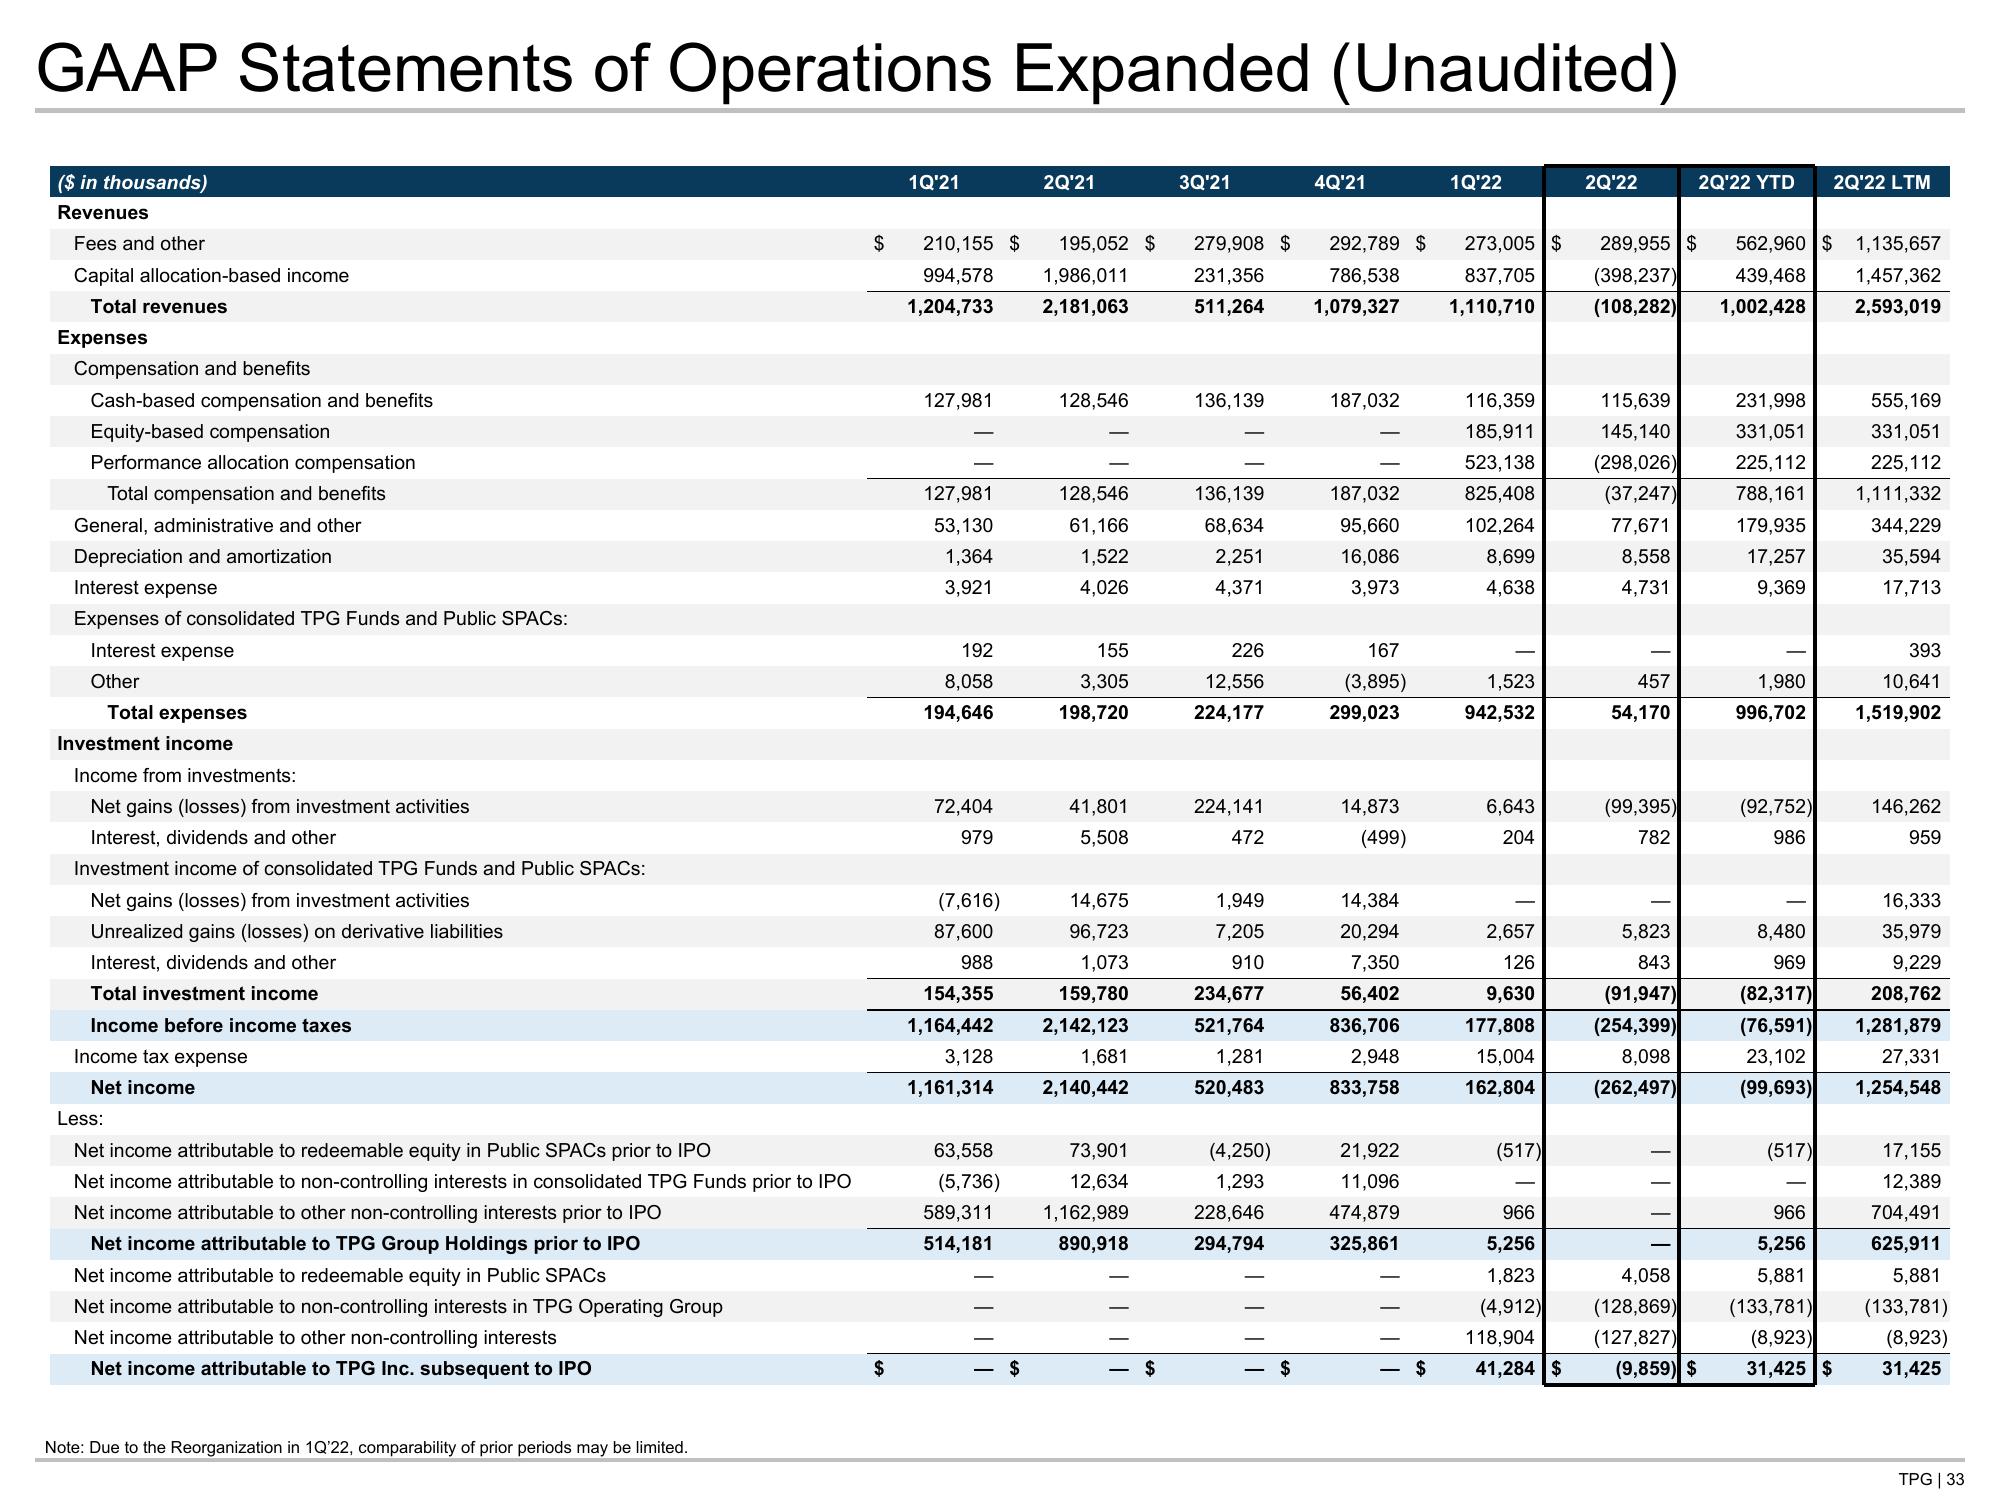
GAAP Statements of Operations Expanded (Unaudited)
($ in thousands)
Revenues
Fees and other
Capital allocation-based income
Total revenues
Expenses
Compensation and benefits
Cash-based compensation and benefits
Equity-based compensation
Performance allocation compensation
Total compensation and benefits
General, administrative and other
Depreciation and amortization
Interest expense
Expenses of consolidated TPG Funds and Public SPACS:
Interest expense
Other
Total expenses
Investment income
Income from investments:
Net gains (losses) from investment activities
Interest, dividends and other
Investment income of consolidated TPG Funds and Public SPACs:
Net gains (losses) from investment activities
Unrealized gains (losses) on derivative liabilities
Interest, dividends and other
Total investment income
Income before income taxes
Income tax expense
Net income
Less:
Net income attributable to redeemable equity in Public SPACs prior to IPO
Net income attributable to non-controlling interests in consolidated TPG Funds prior to IPO
Net income attributable to other non-controlling interests prior to IPO
Net income attributable to TPG Group Holdings prior to IPO
Net income attributable to redeemable equity in Public SPACs
Net income attributable to non-controlling interests in TPG Operating Group
Net income attributable to other non-controlling interests
Net income attributable to TPG Inc. subsequent to IPO
Note: Due to the Reorganization in 1Q'22, comparability of prior periods may be limited.
$
$
1Q'21
210,155 $ 195,052 $
994,578 1,986,011
1,204,733 2,181,063
127,981
127,981
53,130
1,364
3,921
192
8,058
194,646
72,404
979
63,558
(5,736)
2Q'21
589,311
514,181
$
128,546
128,546
61,166
1,522
4,026
(7,616)
87,600
988
154,355
1,164,442
3,128
1,161,314 2,140,442
155
3,305
198,720
41,801
5,508
14,675
96,723
1,073
159,780
2,142,123
1,681
73,901
12,634
1,162,989
890,918
$
3Q'21
279,908 $ 292,789 $
231,356
511,264
786,538
1,079,327
136,139
136,139
68,634
2,251
4,371
226
12,556
224,177
224,141
472
1,949
7,205
910
234,677
521,764
1,281
520,483
(4,250)
1,293
228,646
294,794
4Q'21
$
187,032
187,032
95,660
16,086
3,973
167
(3,895)
299,023
14,873
(499)
14,384
20,294
7,350
56,402
836,706
2,948
833,758
21,922
11,096
474,879
325,861
1Q'22
116,359
185,911
523,138
825,408
102,264
8,699
4,638
1,523
942,532
273,005 $ 289,955 $ 562,960 $ 1,135,657
837,705
1,110,710
1,457,362
(398,237) 439,468
(108,282) 1,002,428
2,593,019
6,643
204
2,657
126
9,630
177,808
15,004
162,804
(517)
2Q'22
966
5,256
1,823
(4,912)
118,904
41,284 $
115,639
145,140
(298,026)
(37,247)
77,671
8,558
4,731
457
54,170
(99,395)
782
5,823
843
(91,947)
(254,399)
8,098
(262,497)
2Q'22 YTD
4,058
(128,869)
(127,827)
(9,859) $
231,998
331,051
225,112
788,161
179,935
17,257
9,369
1,980
996,702
(92,752)
986
8,480
969
(82,317)
(76,591)
23,102
(99,693)
2Q'22 LTM
(517)
966
5,256
5,881
(133,781)
(8,923)
31,425 $
555,169
331,051
225,112
1,111,332
344,229
35,594
17,713
393
10,641
1,519,902
146,262
959
16,333
35,979
9,229
208,762
1,281,879
27,331
1,254,548
17,155
12,389
704,491
625,911
5,881
(133,781)
(8,923)
31,425
TPG | 33View entire presentation