CubeSmart Investor Presentation Deck slide image

CubeSmart Investor Presentation Deck

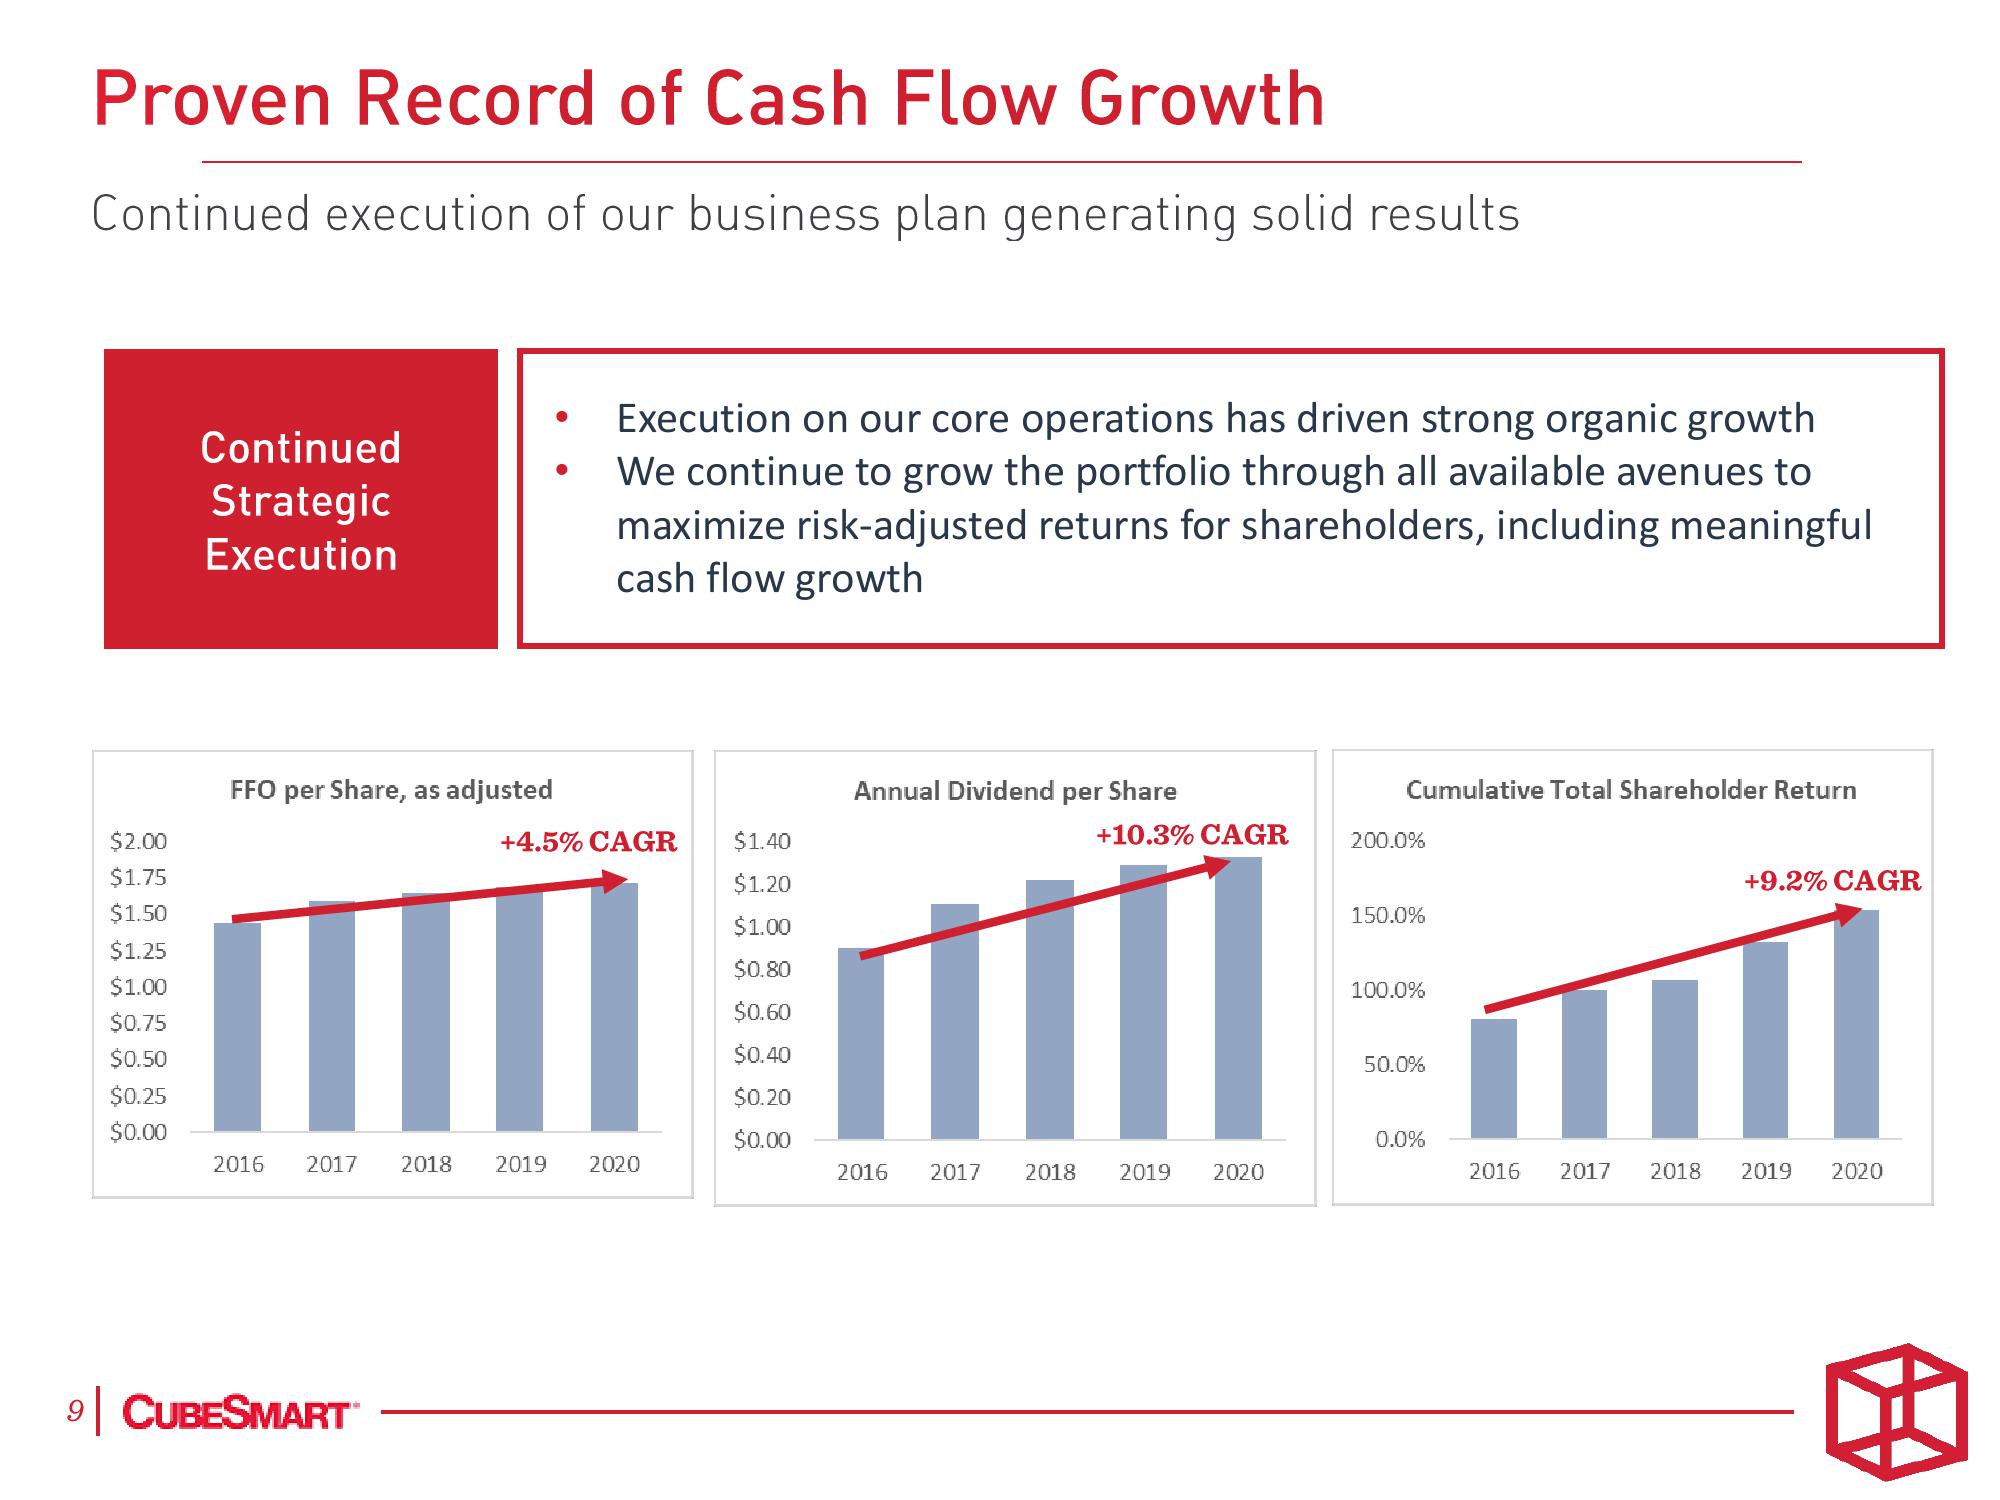
Proven Record of Cash Flow Growth Continued execution of our business plan generating solid results $2.00 $1.75 $1.50 $1.25 $1.00 $0.75 $0.50 $0.25 $0.00 Continued Strategic Execution FFO per Share, as adjusted 2016 2017 2018 9| CUBESMART Execution on our core operations has driven strong organic growth We continue to grow the portfolio through all available avenues to maximize risk-adjusted returns for shareholders, including meaningful cash flow growth +4.5% CAGR 2019 2020 $1.40 $1.20 $1.00 $0.80 $0.60 $0.40 $0.20 $0.00 Annual Dividend per 2016 2017 Share +10.3% CAGR 2018 2019 2020 Cumulative Total Shareholder Return 200.0% 150.0% 100.0% 50.0% 0.0% 2016 2017 2018 +9.2% CAGR 2019 2020
View entire presentation