Hydrafacial SPAC Presentation Deck
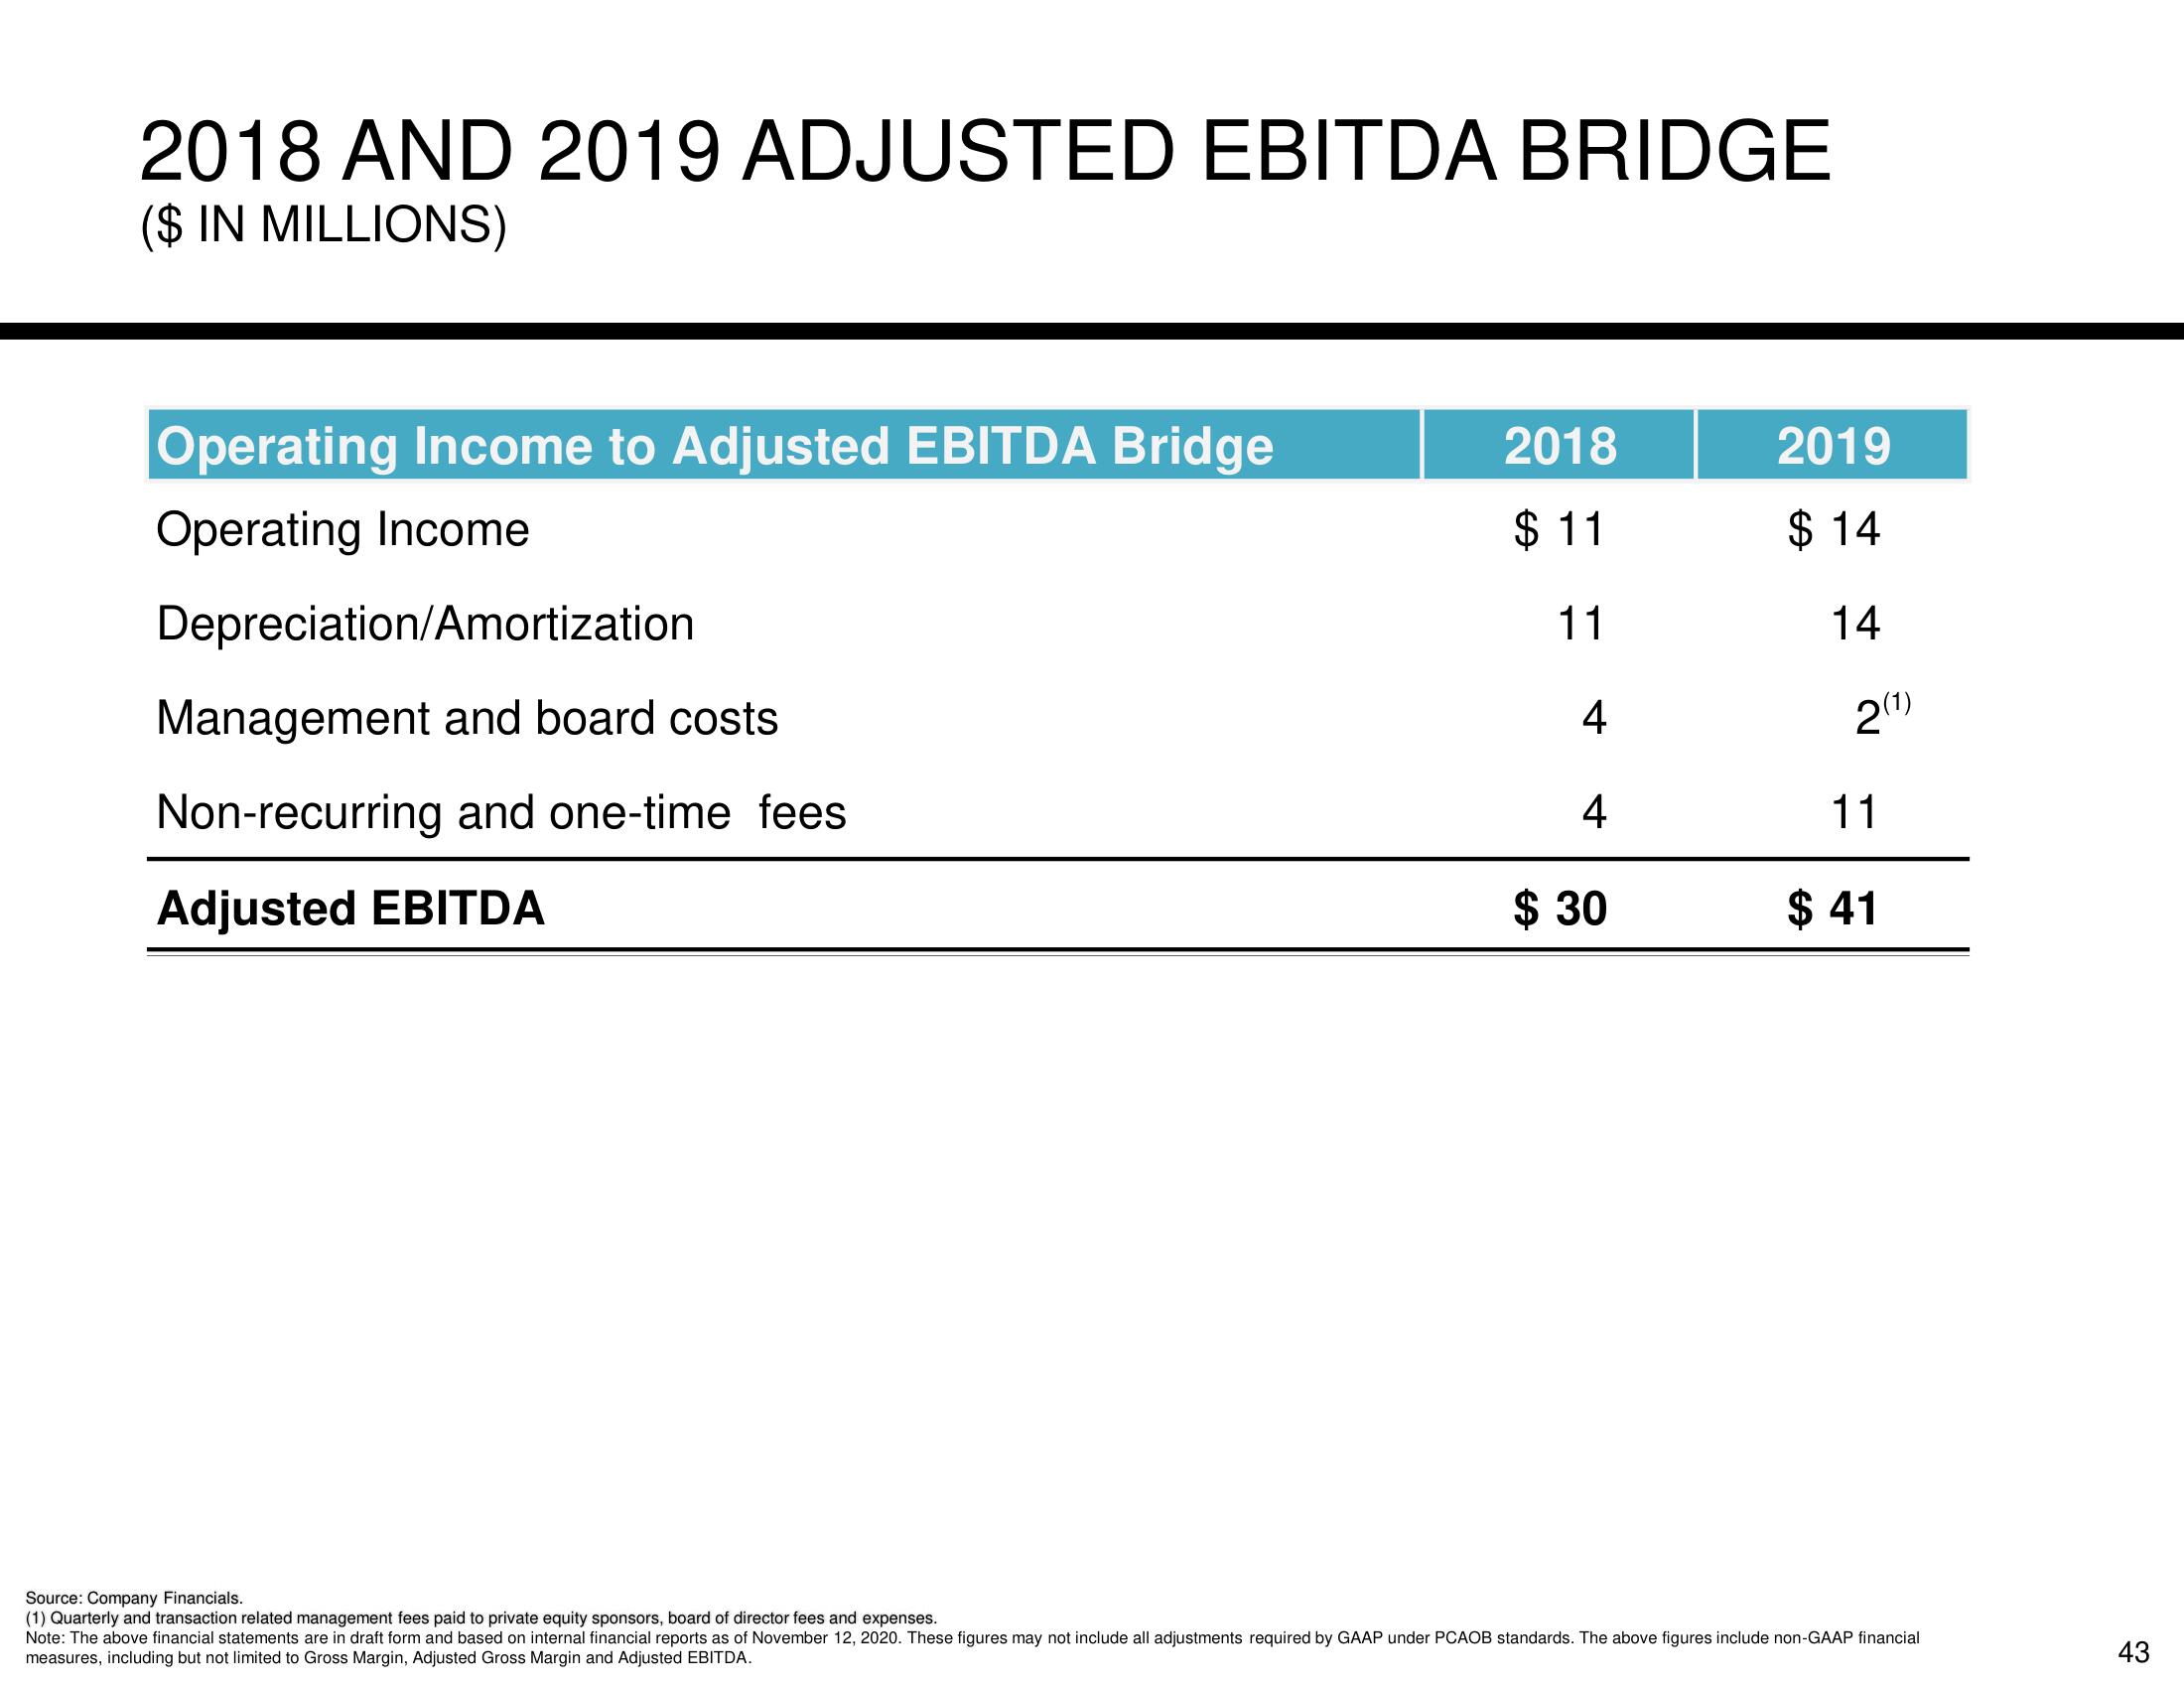
2018 AND 2019 ADJUSTED EBITDA BRIDGE
($ IN MILLIONS)
Operating Income to Adjusted EBITDA Bridge
Operating Income
Depreciation/Amortization
Management and board costs
Non-recurring and one-time fees
Adjusted EBITDA
2018
$11
11
4
4
$30
2019
$14
14
2(1)
11
$41
Source: Company Financials.
(1) Quarterly and transaction related management fees paid to private equity sponsors, board of director fees and expenses.
Note: The above financial statements are in draft form and based on internal financial reports as of November 12, 2020. These figures may not include all adjustments required by GAAP under PCAOB standards. The above figures include non-GAAP financial
measures, including but not limited to Gross Margin, Adjusted Gross Margin and Adjusted EBITDA.
43View entire presentation