Taboola Investor Presentation Deck
STRONG FINANCIAL PROFILE
Taboola
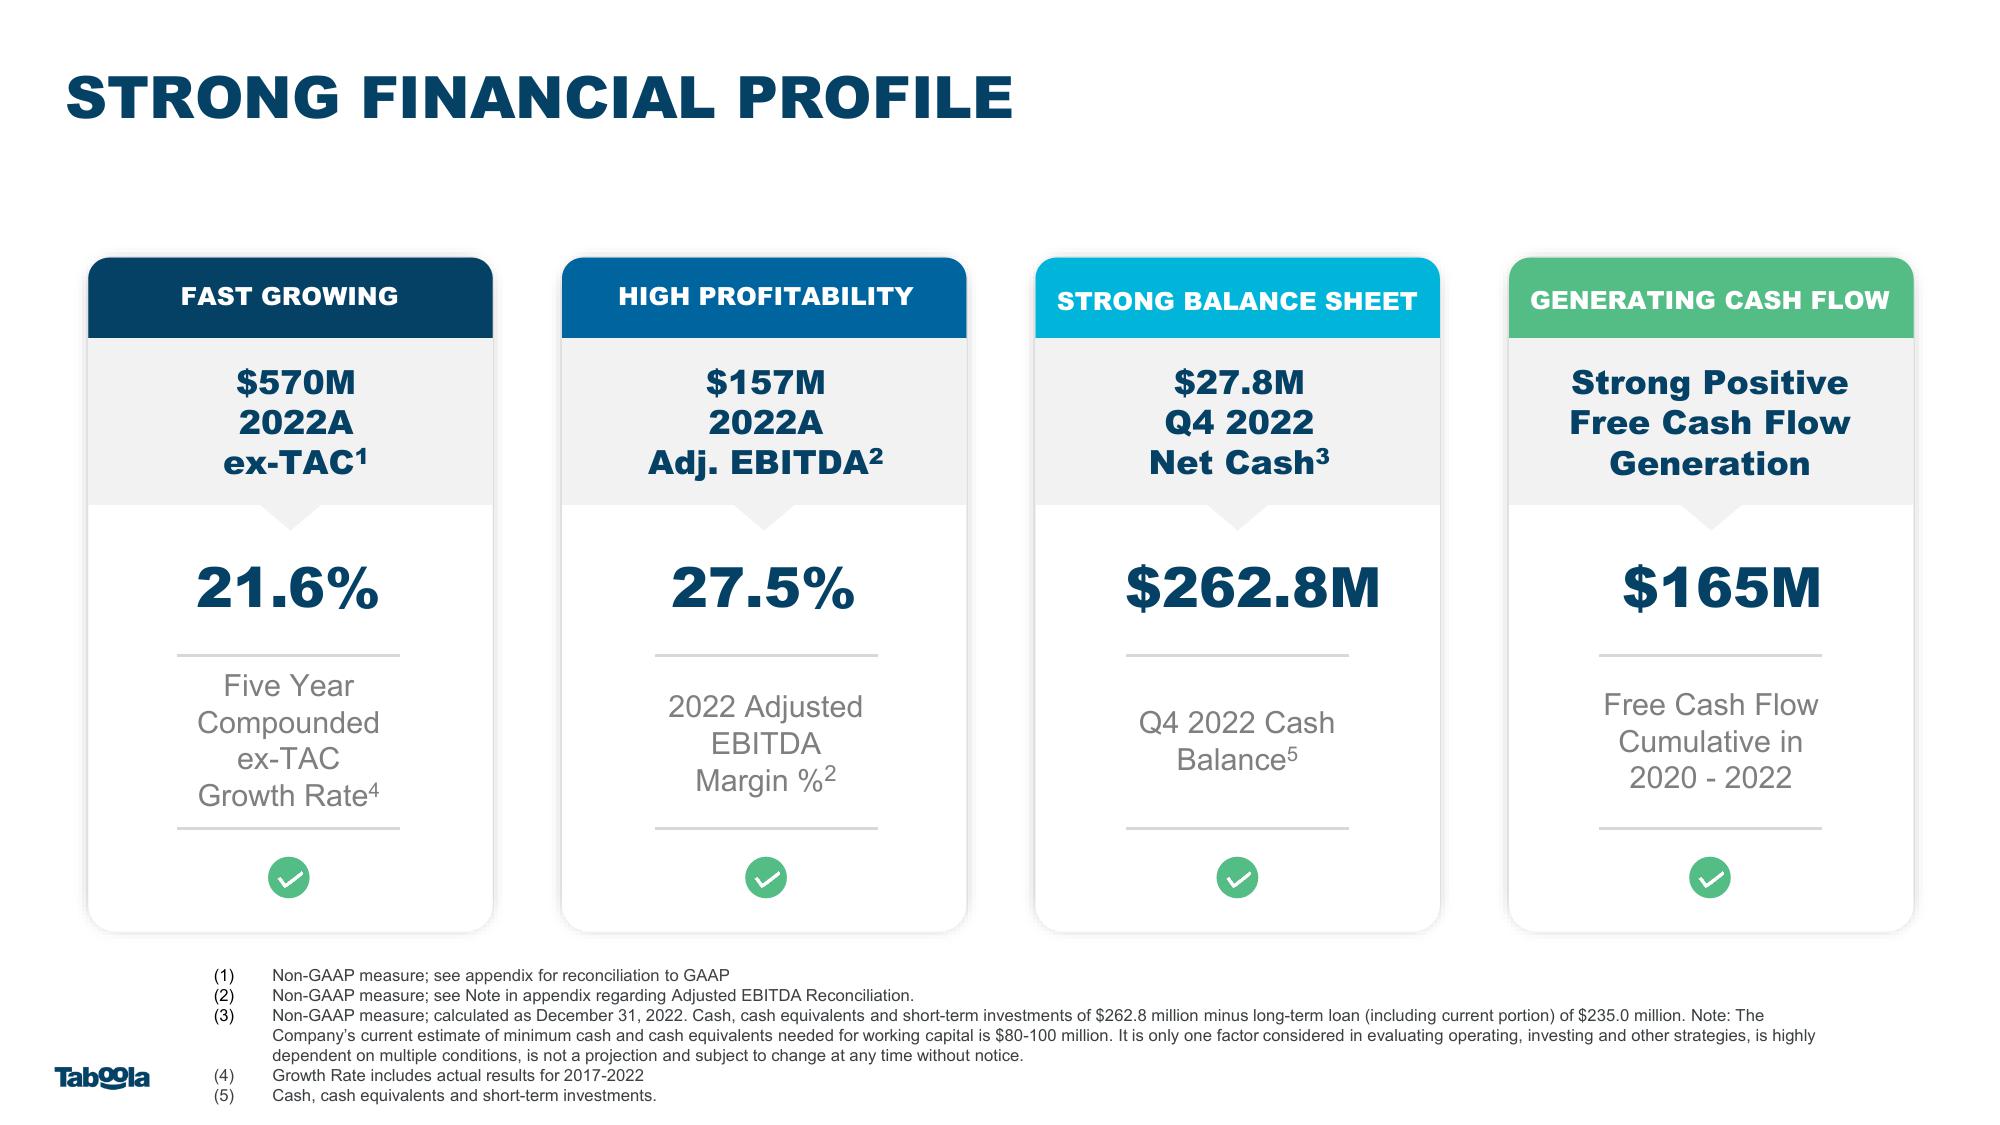
FAST GROWING
$570M
2022A
ex-TAC¹
21.6%
Five Year
Compounded
ex-TAC
Growth Rate4
(1)
(2)
(3)
(4)
(5)
HIGH PROFITABILITY
$157M
2022A
Adj. EBITDA²
27.5%
2022 Adjusted
EBITDA
Margin %²
STRONG BALANCE SHEET
$27.8M
Q4 2022
Net Cash³
$262.8M
Q4 2022 Cash
Balance5
GENERATING CASH FLOW
Strong Positive
Free Cash Flow
Generation
$165M
Free Cash Flow
Cumulative in
2020-2022
Non-GAAP measure; see appendix for reconciliation to GAAP
Non-GAAP measure; see Note in appendix regarding Adjusted EBITDA Reconciliation.
Non-GAAP measure; calculated as December 31, 2022. Cash, cash equivalents and short-term investments of $262.8 million minus long-term loan (including current portion) of $235.0 million. Note: The
Company's current estimate of minimum cash and cash equivalents needed for working capital is $80-100 million. It is only one factor considered in evaluating operating, investing and other strategies, is highly
dependent on multiple conditions, is not a projection and subject to change at any time without notice.
Growth Rate includes actual results for 2017-2022
Cash, cash equivalents and short-term investments.View entire presentation