AMC Other Presentation Deck
Valuation Multiples
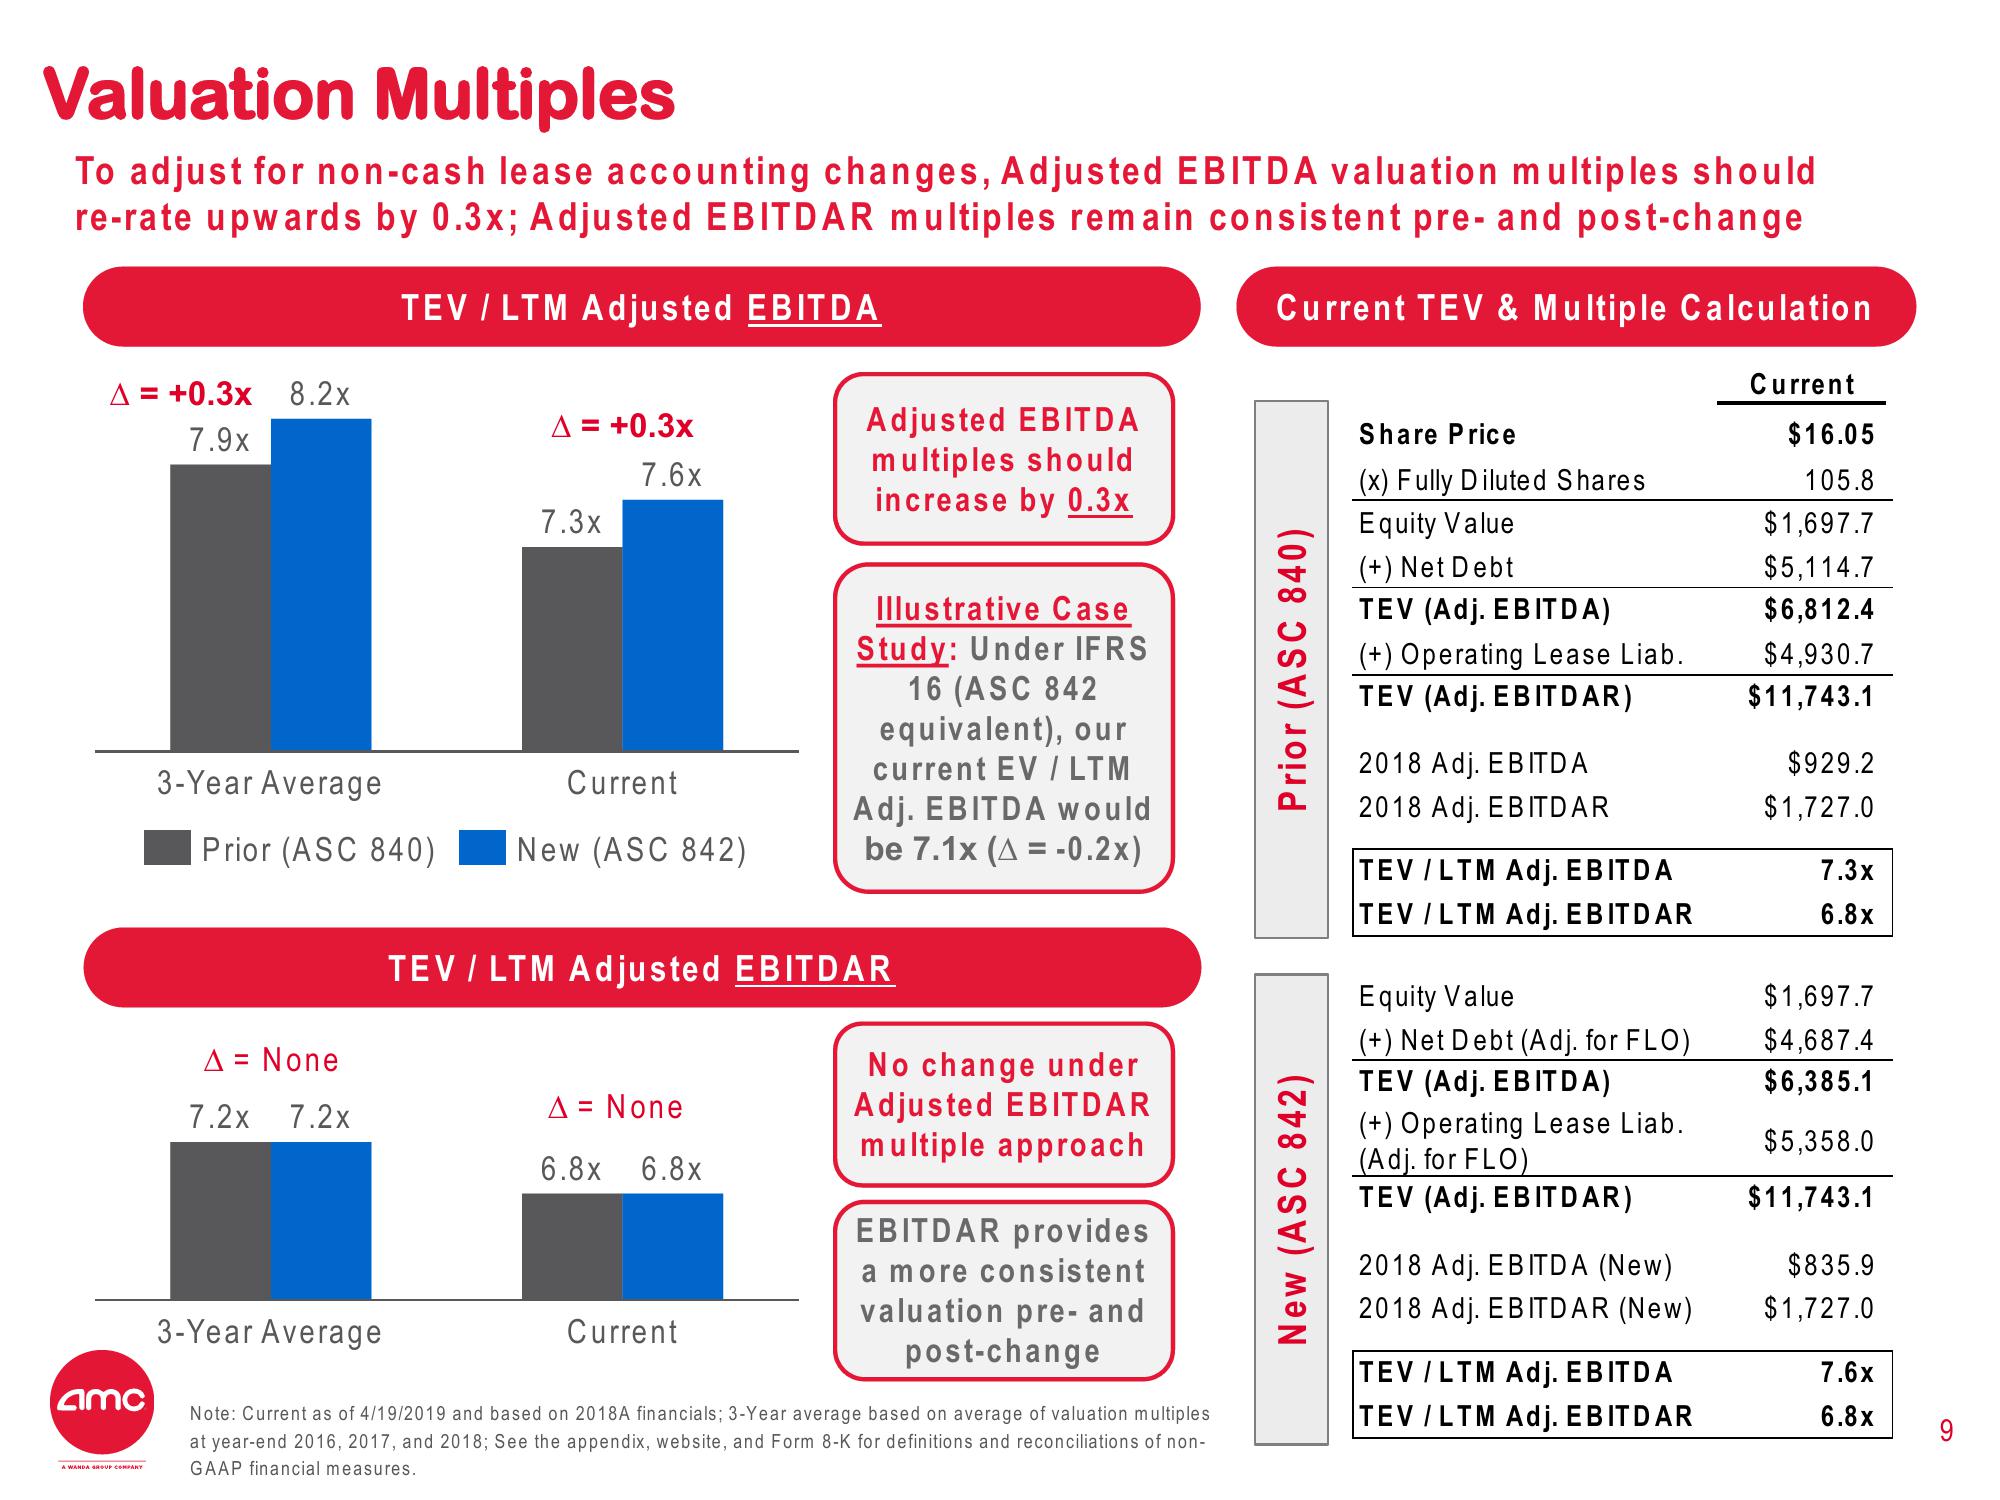
To adjust for non-cash lease accounting changes, Adjusted EBITDA valuation multiples should
re-rate upwards by 0.3x; Adjusted EBITDAR multiples remain consistent pre- and post-change
TEV / LTM Adjusted EBITDA
Current TEV & Multiple Calculation
A = +0.3x 8.2x
7.9x
amc
A WANDA GROUP COMPANY
3-Year Average
Prior (ASC 840)
A = None
7.2x 7.2x
3-Year Average
A = +0.3x
7.6x
7.3x
Current
New (ASC 842)
A = None
6.8x 6.8x
Adjusted EBITDA
multiples should
increase by 0.3x
TEV / LTM Adjusted EBITDAR
Current
Illustrative Case
Study: Under IFRS
16 (ASC 842
equivalent), our
current EV / LTM
Adj. EBITDA would
be 7.1x (A = -0.2x)
No change under
Adjusted EBITDAR
multiple approach
EBITDAR provides
a more consistent
valuation pre- and
post-change
Note: Current as of 4/19/2019 and based on 2018A financials; 3-Year average based on average of valuation multiples
at year-end 2016, 2017, and 2018; See the appendix, website, and Form 8-K for definitions and reconciliations of non-
GAAP financial measures.
Prior (ASC 840)
New (ASC 842)
Share Price
(x) Fully Diluted Shares
Equity Value
(+) Net Debt
TEV (Adj. EBITDA)
(+) Operating Lease Liab.
TEV (Adj. EBITDAR)
2018 Adj. EBITDA
2018 Adj. EBITDAR
TEV / LTM Adj. EBITDA
TEV / LTM Adj. EBITDAR
Equity Value
(+) Net Debt (Adj. for FLO)
TEV (Adj. EBITDA)
(+) Operating Lease Liab.
(Adj. for FLO)
TEV (Adj. EBITDAR)
2018 Adj. EBITDA (New)
2018 Adj. EBITDAR (New)
TEV / LTM Adj. EBITDA
TEV / LTM Adj. EBITDAR
Current
$16.05
105.8
$1,697.7
$5,114.7
$6,812.4
$4,930.7
$11,743.1
$929.2
$1,727.0
7.3x
6.8x
$1,697.7
$4,687.4
$6,385.1
$5,358.0
$11,743.1
$835.9
$1,727.0
7.6x
6.8xView entire presentation