dLocal Results Presentation Deck
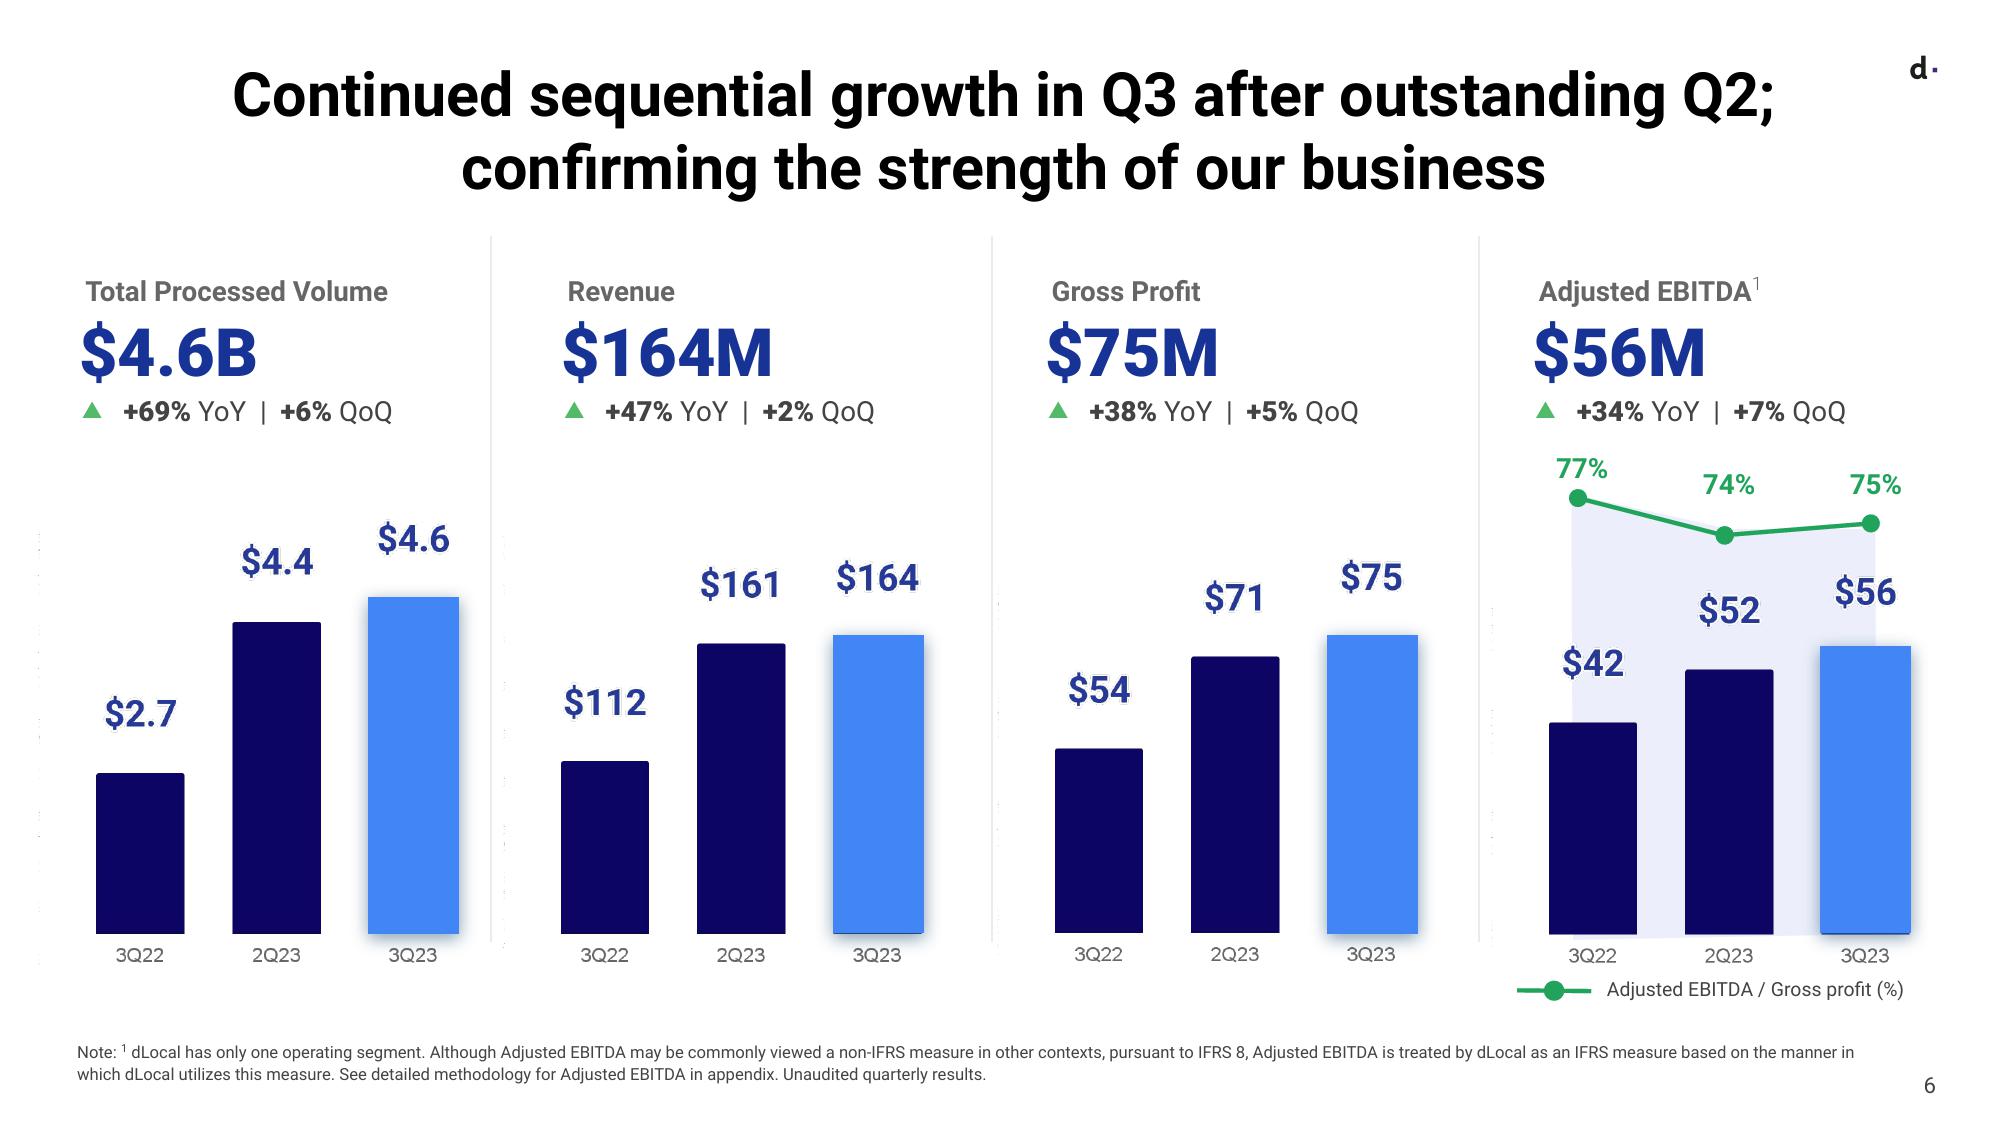
Total Processed Volume
$4.6B
▲ +69% YOY | +6% QOQ
$2.7
Continued sequential growth in Q3 after outstanding Q2;
confirming the strength of our business
3Q22
$4.4
I
2Q23
$4.6
3Q23
Revenue
$164M
▲ +47% YoY | +2% QOQ
$112
3Q22
$161 $164
2Q23
3Q23
Gross Profit
$75M
+38% YoY | +5% QOQ
$54
3Q22
$71
2Q23
$75
3Q23
Adjusted EBITDA¹
$56M
+34% YoY | +7% QOQ
77%
$42
74%
3Q22
$56
11
2Q23
3Q23
Adjusted EBITDA / Gross profit (%)
75%
$52
d.
Note: ¹ dLocal has only one operating segment. Although Adjusted EBITDA may be commonly viewed a non-IFRS measure in other contexts, pursuant to IFRS 8, Adjusted EBITDA is treated by dLocal as an IFRS measure based on the manner in
which dLocal utilizes this measure. See detailed methodology for Adjusted EBITDA in appendix. Unaudited quarterly results.
6View entire presentation