Oaktree Real Estate Opportunities Fund VII, L.P.
OAKTREE REAL ESTATE OPPORTUNITIES FUND VII, L.P.
Established Track Record
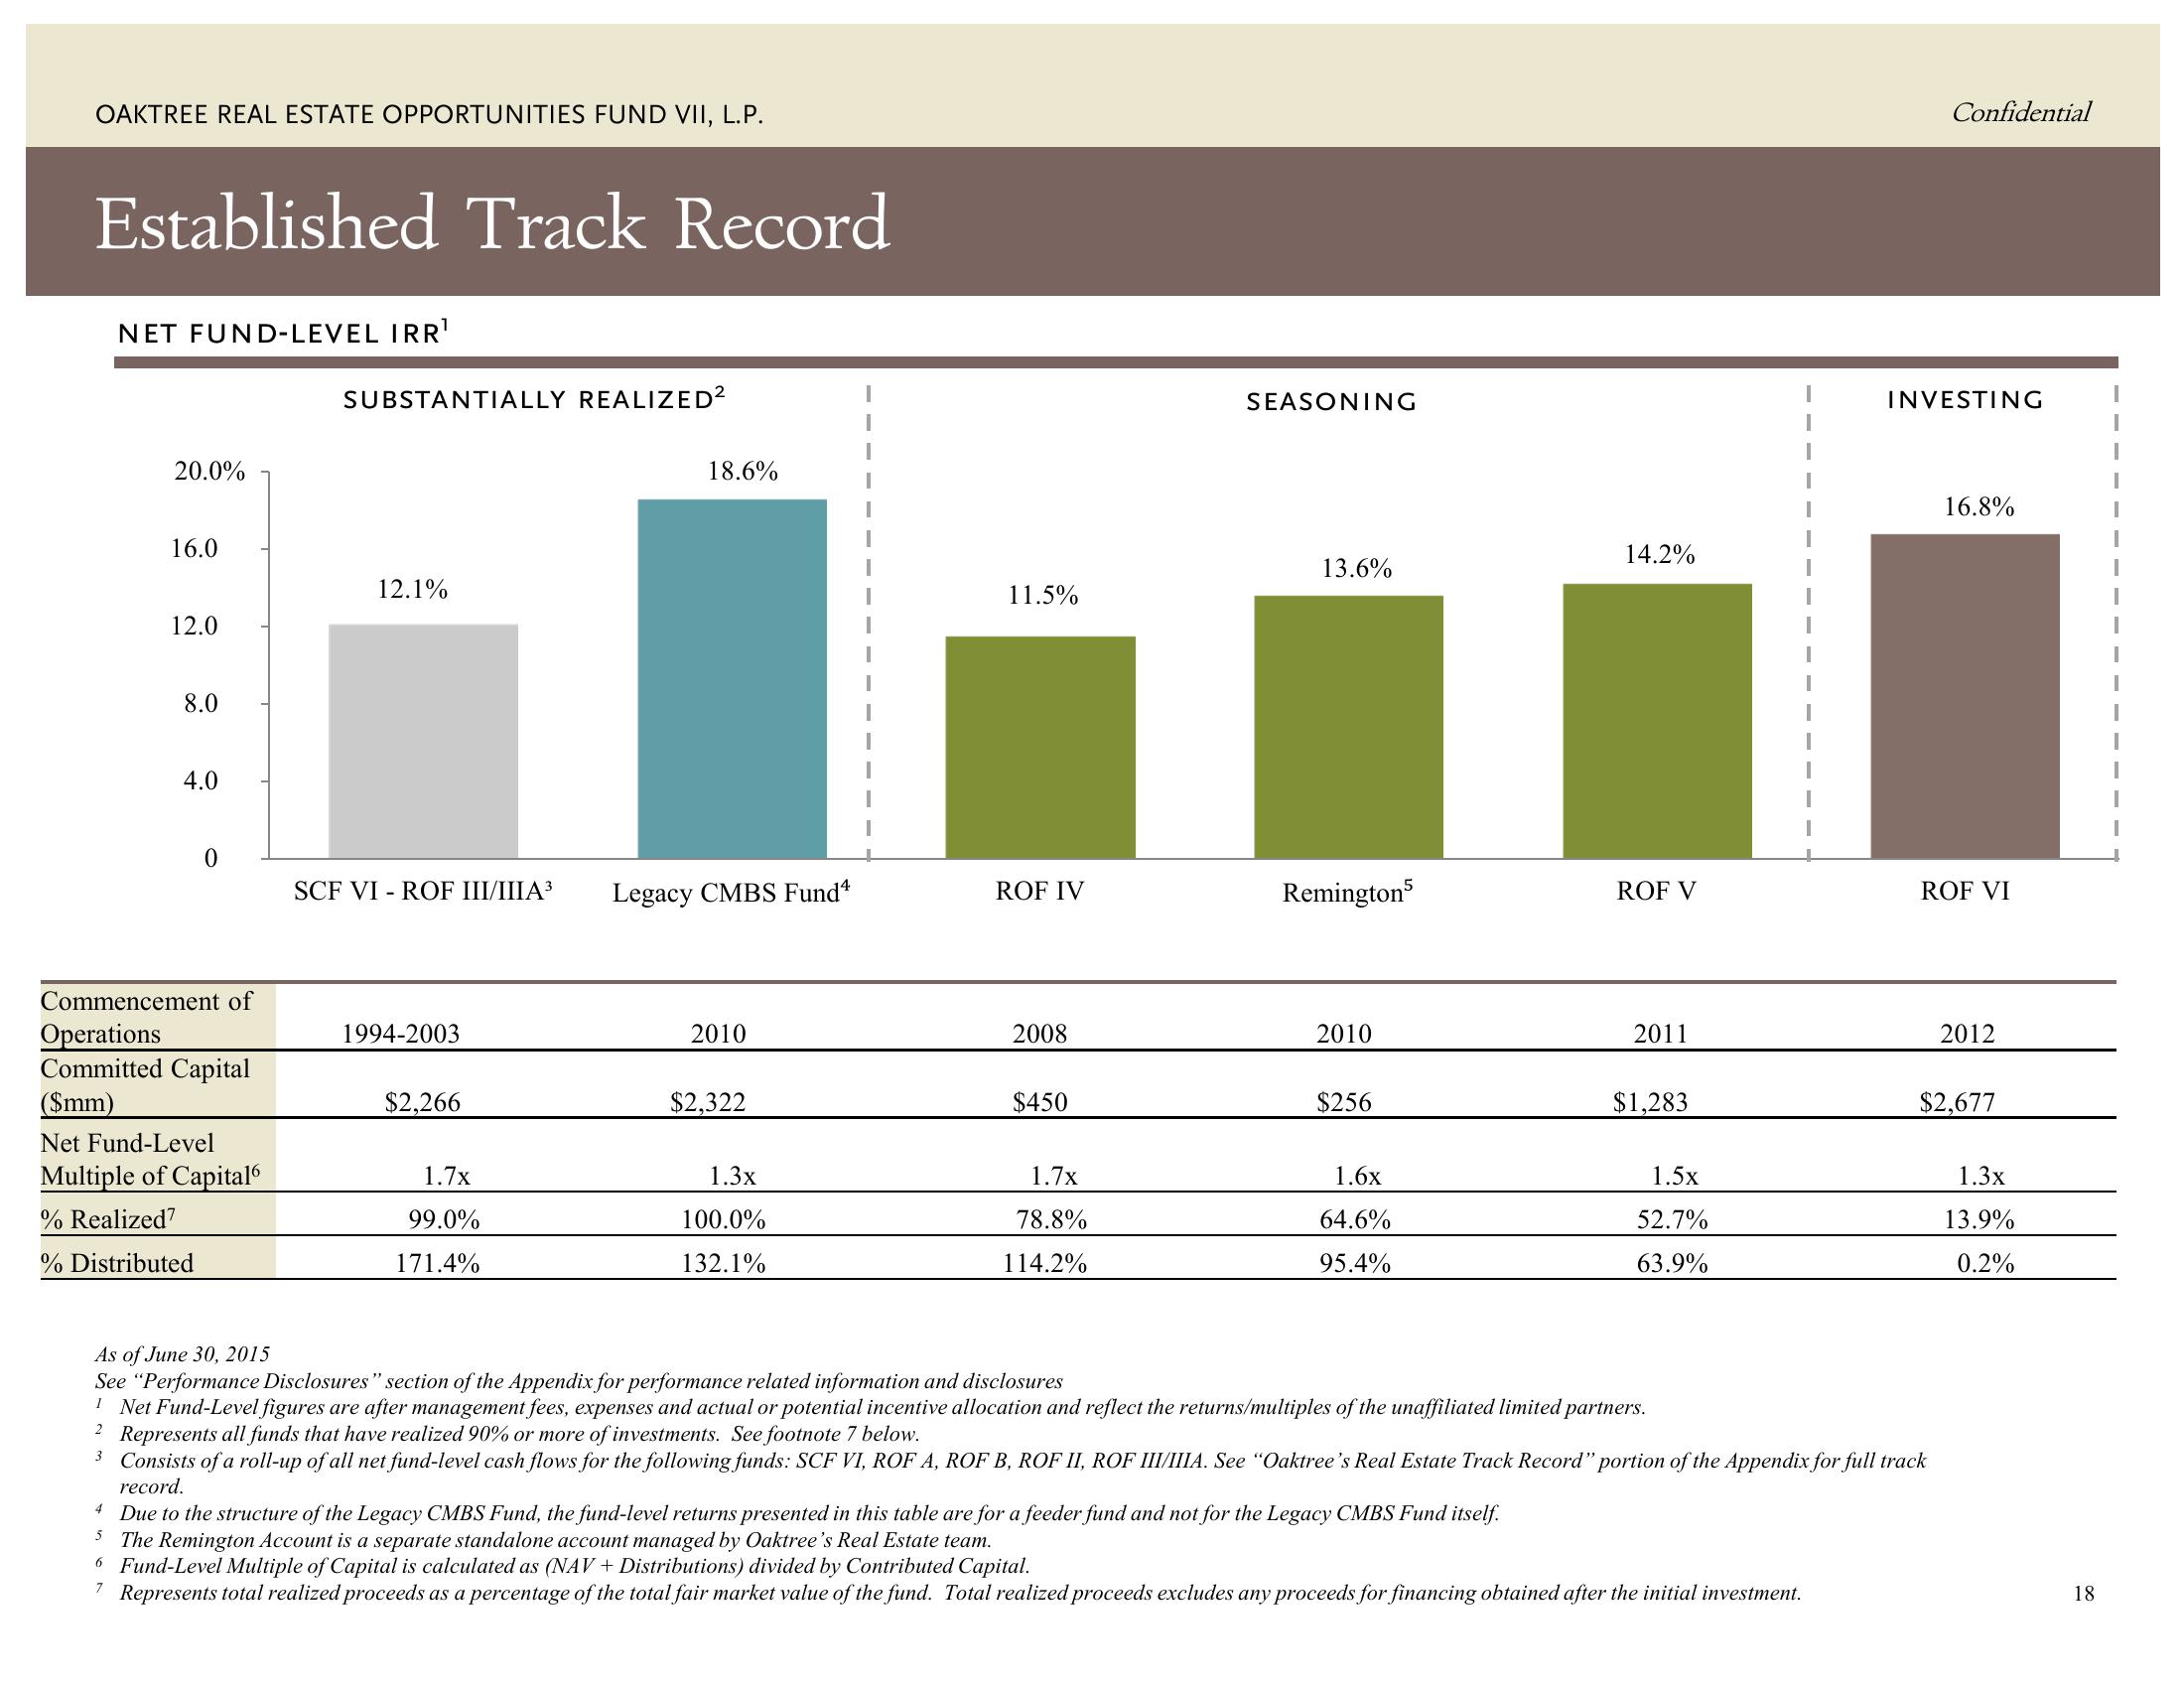
NET FUND-LEVEL IRR¹
20.0%
16.0
12.0
8.0
4.0
0
Commencement of
Operations
Committed Capital
($mm)
Net Fund-Level
Multiple of Capital
% Realized7
% Distributed
SUBSTANTIALLY REALIZED²
12.1%
SCF VIROF III/IIIA³
1994-2003
$2,266
1.7x
99.0%
171.4%
18.6%
Legacy CMBS Fundª
2010
$2,322
1.3x
100.0%
132.1%
I
11.5%
ROF IV
2008
$450
1.7x
78.8%
114.2%
SEASONING
13.6%
Remington5
2010
$256
1.6x
64.6%
95.4%
14.2%
ROF V
2011
$1,283
1.5x
52.7%
63.9%
As of June 30, 2015
See "Performance Disclosures" section of the Appendix for performance related information and disclosures
1 Net Fund-Level figures are after management fees, expenses and actual or potential incentive allocation and reflect the returns/multiples of the unaffiliated limited partners.
2 Represents all funds that have realized 90% or more of investments. See footnote 7 below.
I
4 Due to the structure of the Legacy CMBS Fund, the fund-level returns presented in this table are for a feeder fund and not for the Legacy CMBS Fund itself.
5 The Remington Account is a separate standalone account managed by Oaktree's Real Estate team.
6 Fund-Level Multiple of Capital is calculated as (NAV+ Distributions) divided by Contributed Capital.
7
Represents total realized proceeds as a percentage of the total fair market value of the fund. Total realized proceeds excludes any proceeds for financing obtained after the initial investment.
Confidential
INVESTING
3 Consists of a roll-up of all net fund-level cash flows for the following funds: SCF VI, ROF A, ROF B, ROF II, ROF III/IIIA. See "Oaktree's Real Estate Track Record" portion of the Appendix for full track
record.
16.8%
ROF VI
2012
$2,677
1.3x
13.9%
0.2%
18View entire presentation