Spotify Results Presentation Deck
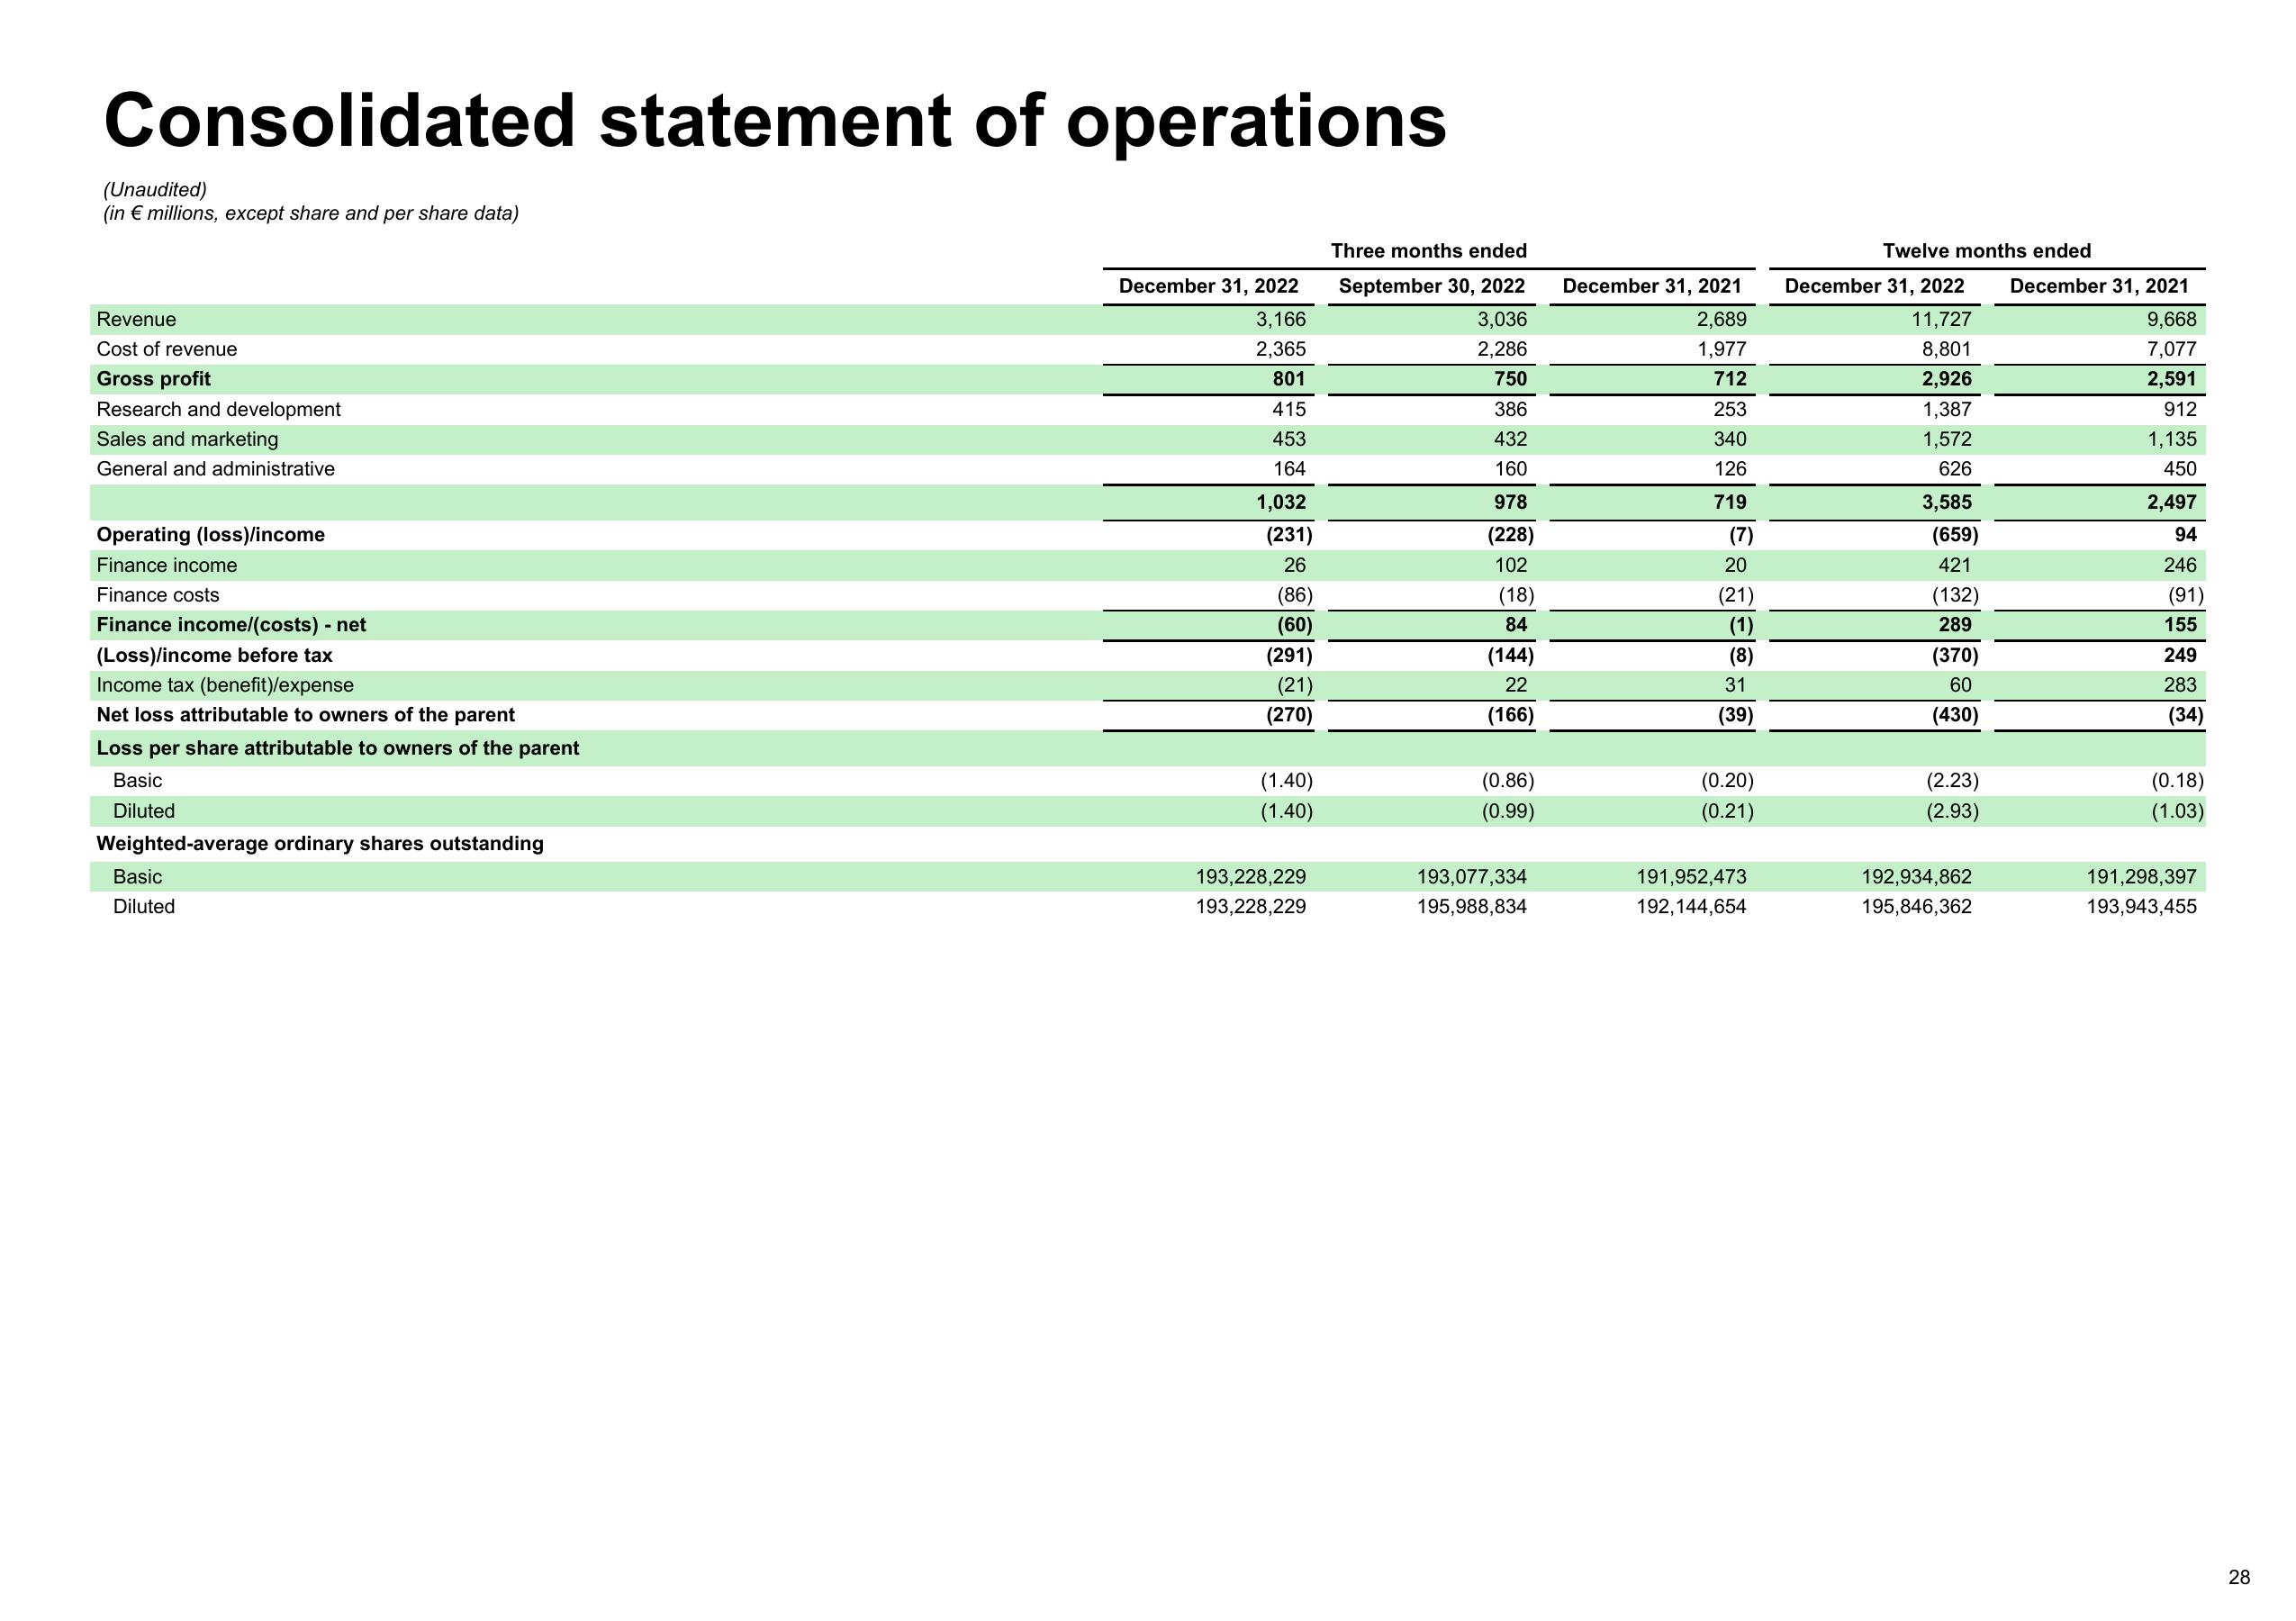
Consolidated statement of operations
(Unaudited)
(in € millions, except share and per share data)
Revenue
Cost of revenue
Gross profit
Research and development
Sales and marketing
General and administrative
Operating (loss)/income
Finance income
Finance costs
Finance income/(costs) - net
(Loss)/income before tax
Income tax (benefit)/expense
Net loss attributable to owners of the parent
Loss per share attributable to owners of the parent
Basic
Diluted
Weighted-average ordinary shares outstanding
Basic
Diluted
December 31, 2022
3,166
2,365
801
415
453
164
1,032
(231)
26
(86)
(60)
(291)
(21)
(270)
(1.40)
(1.40)
193,228,229
193,228,229
Three months ended
September 30, 2022
3,036
2,286
750
386
432
160
978
(228)
102
(18)
84
(144)
22
(166)
(0.86)
(0.99)
193,077,334
195,988,834
December 31, 2021
2,689
1,977
712
253
340
126
719
(7)
20
(21)
(1)
(8)
31
(39)
(0.20)
(0.21)
191,952,473
192,144,654
Twelve months ended
December 31, 2022 December 31, 2021
9,668
11,727
8,801
7,077
2,926
2,591
1,387
912
1,135
1,572
626
450
2,497
94
246
3,585
(659)
421
(132)
289
(370)
60
(430)
(2.23)
(2.93)
192,934,862
195,846,362
(91)
155
249
283
(34)
(0.18)
(1.03)
191,298,397
193,943,455
28View entire presentation