Tesla Results Presentation Deck
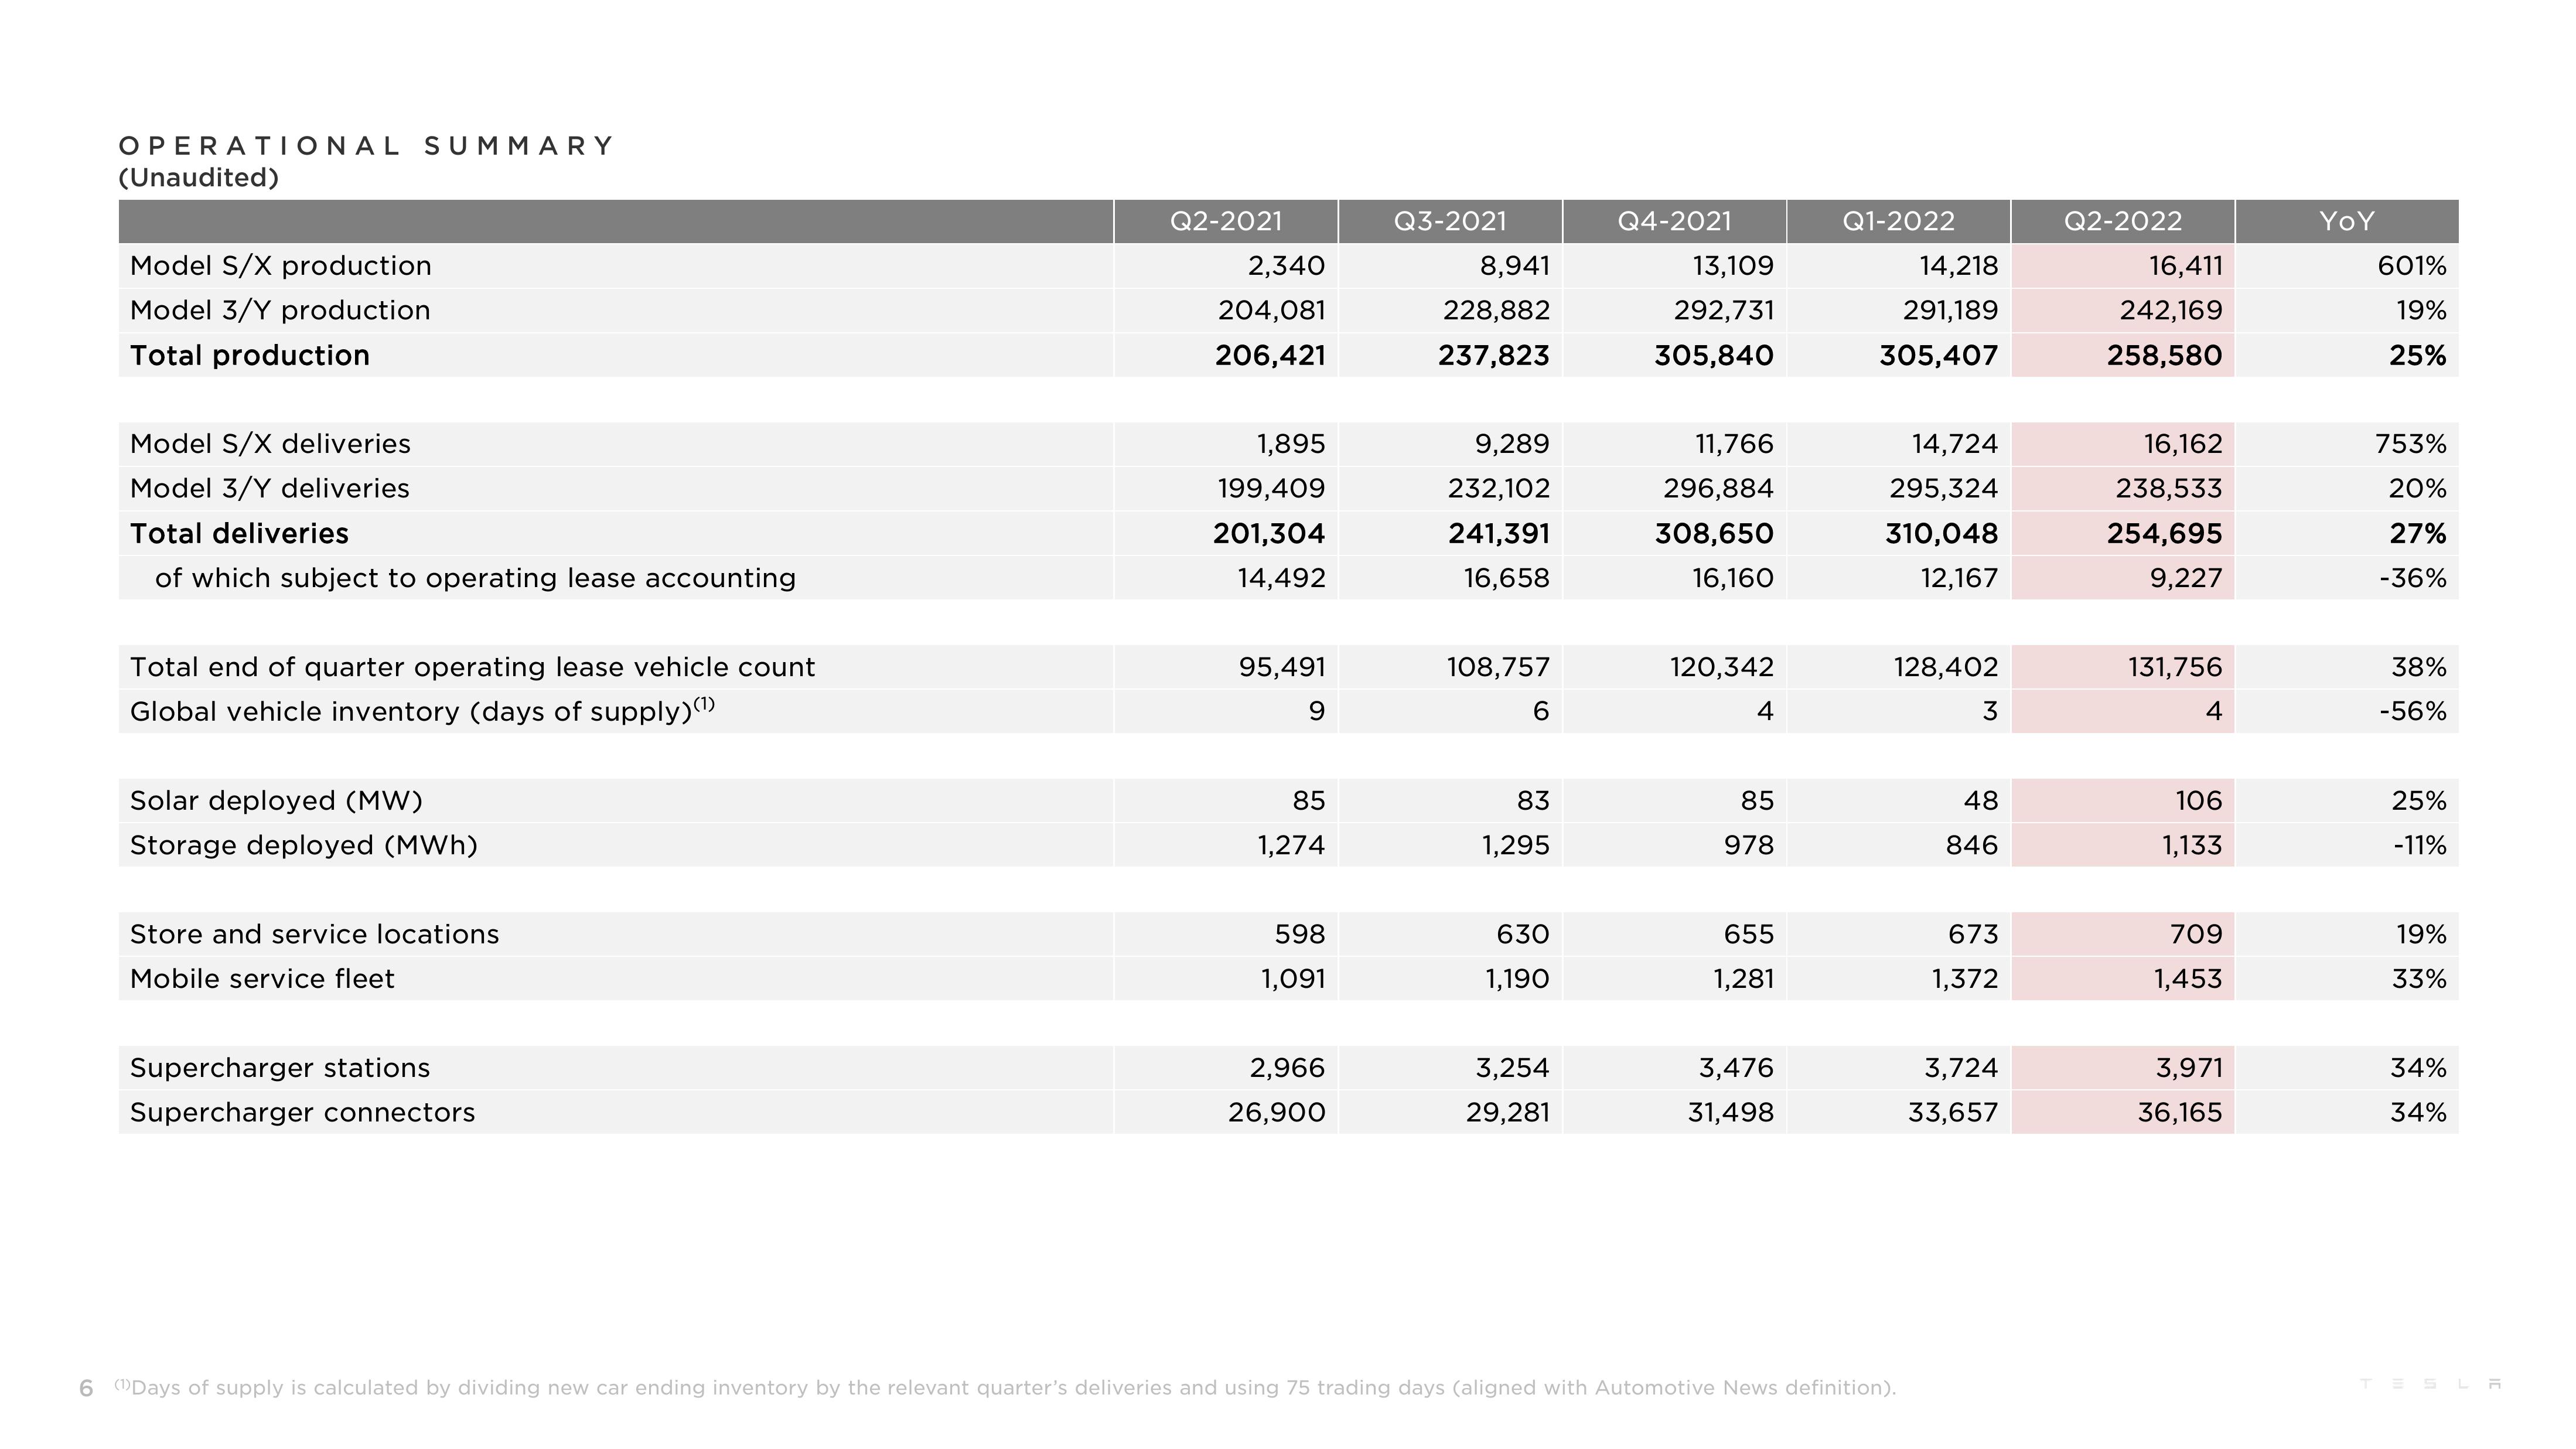
OPERATIONAL SUMMARY
(Unaudited)
Model S/X production
Model 3/Y production
Total production
Model S/X deliveries
Model 3/Y deliveries
Total deliveries
of which subject to operating lease accounting
Total end of quarter operating lease vehicle count
Global vehicle inventory (days of supply)(¹)
Solar deployed (MW)
Storage deployed (MWh)
Store and service locations
Mobile service fleet
Supercharger stations
Supercharger connectors
Q2-2021
2,340
204,081
206,421
1,895
199,409
201,304
14,492
95,491
9
85
1,274
598
1,091
2,966
26,900
Q3-2021
8,941
228,882
237,823
9,289
232,102
241,391
16,658
108,757
6
83
1,295
630
1,190
3,254
29,281
Q4-2021
13,109
292,731
305,840
11,766
296,884
308,650
16,160
120,342
4
85
978
655
1,281
3,476
31,498
Q1-2022
14,218
291,189
305,407
14,724
295,324
310,048
12,167
128,402
6 Days of supply is calculated by dividing new car ending inventory by the relevant quarter's deliveries and using 75 trading days (aligned with Automotive News definition).
3
48
846
673
1,372
3,724
33,657
Q2-2022
16,411
242,169
258,580
16,162
238,533
254,695
9,227
131,756
4
106
1,133
709
1,453
3,971
36,165
YoY
601%
19%
25%
753%
20%
27%
-36%
38%
-56%
25%
-11%
19%
33%
34%
34%
TESLAView entire presentation