Commercial Metals Company Results Presentation Deck
Q3 Europe
Performance Summary
Units in 000's except per ton amounts
Adjusted EBITDA
Adjusted EBITDA per Ton of Finished Steel
Shipped
External Finished Steel Tons Shipped [¹]
Adjusted EBITDA Margin
Key Performance Drivers
Q3 2023 vs Q3 2022
●
●
●
Q3 '22
476
CMC
Q4 '22
25.0%
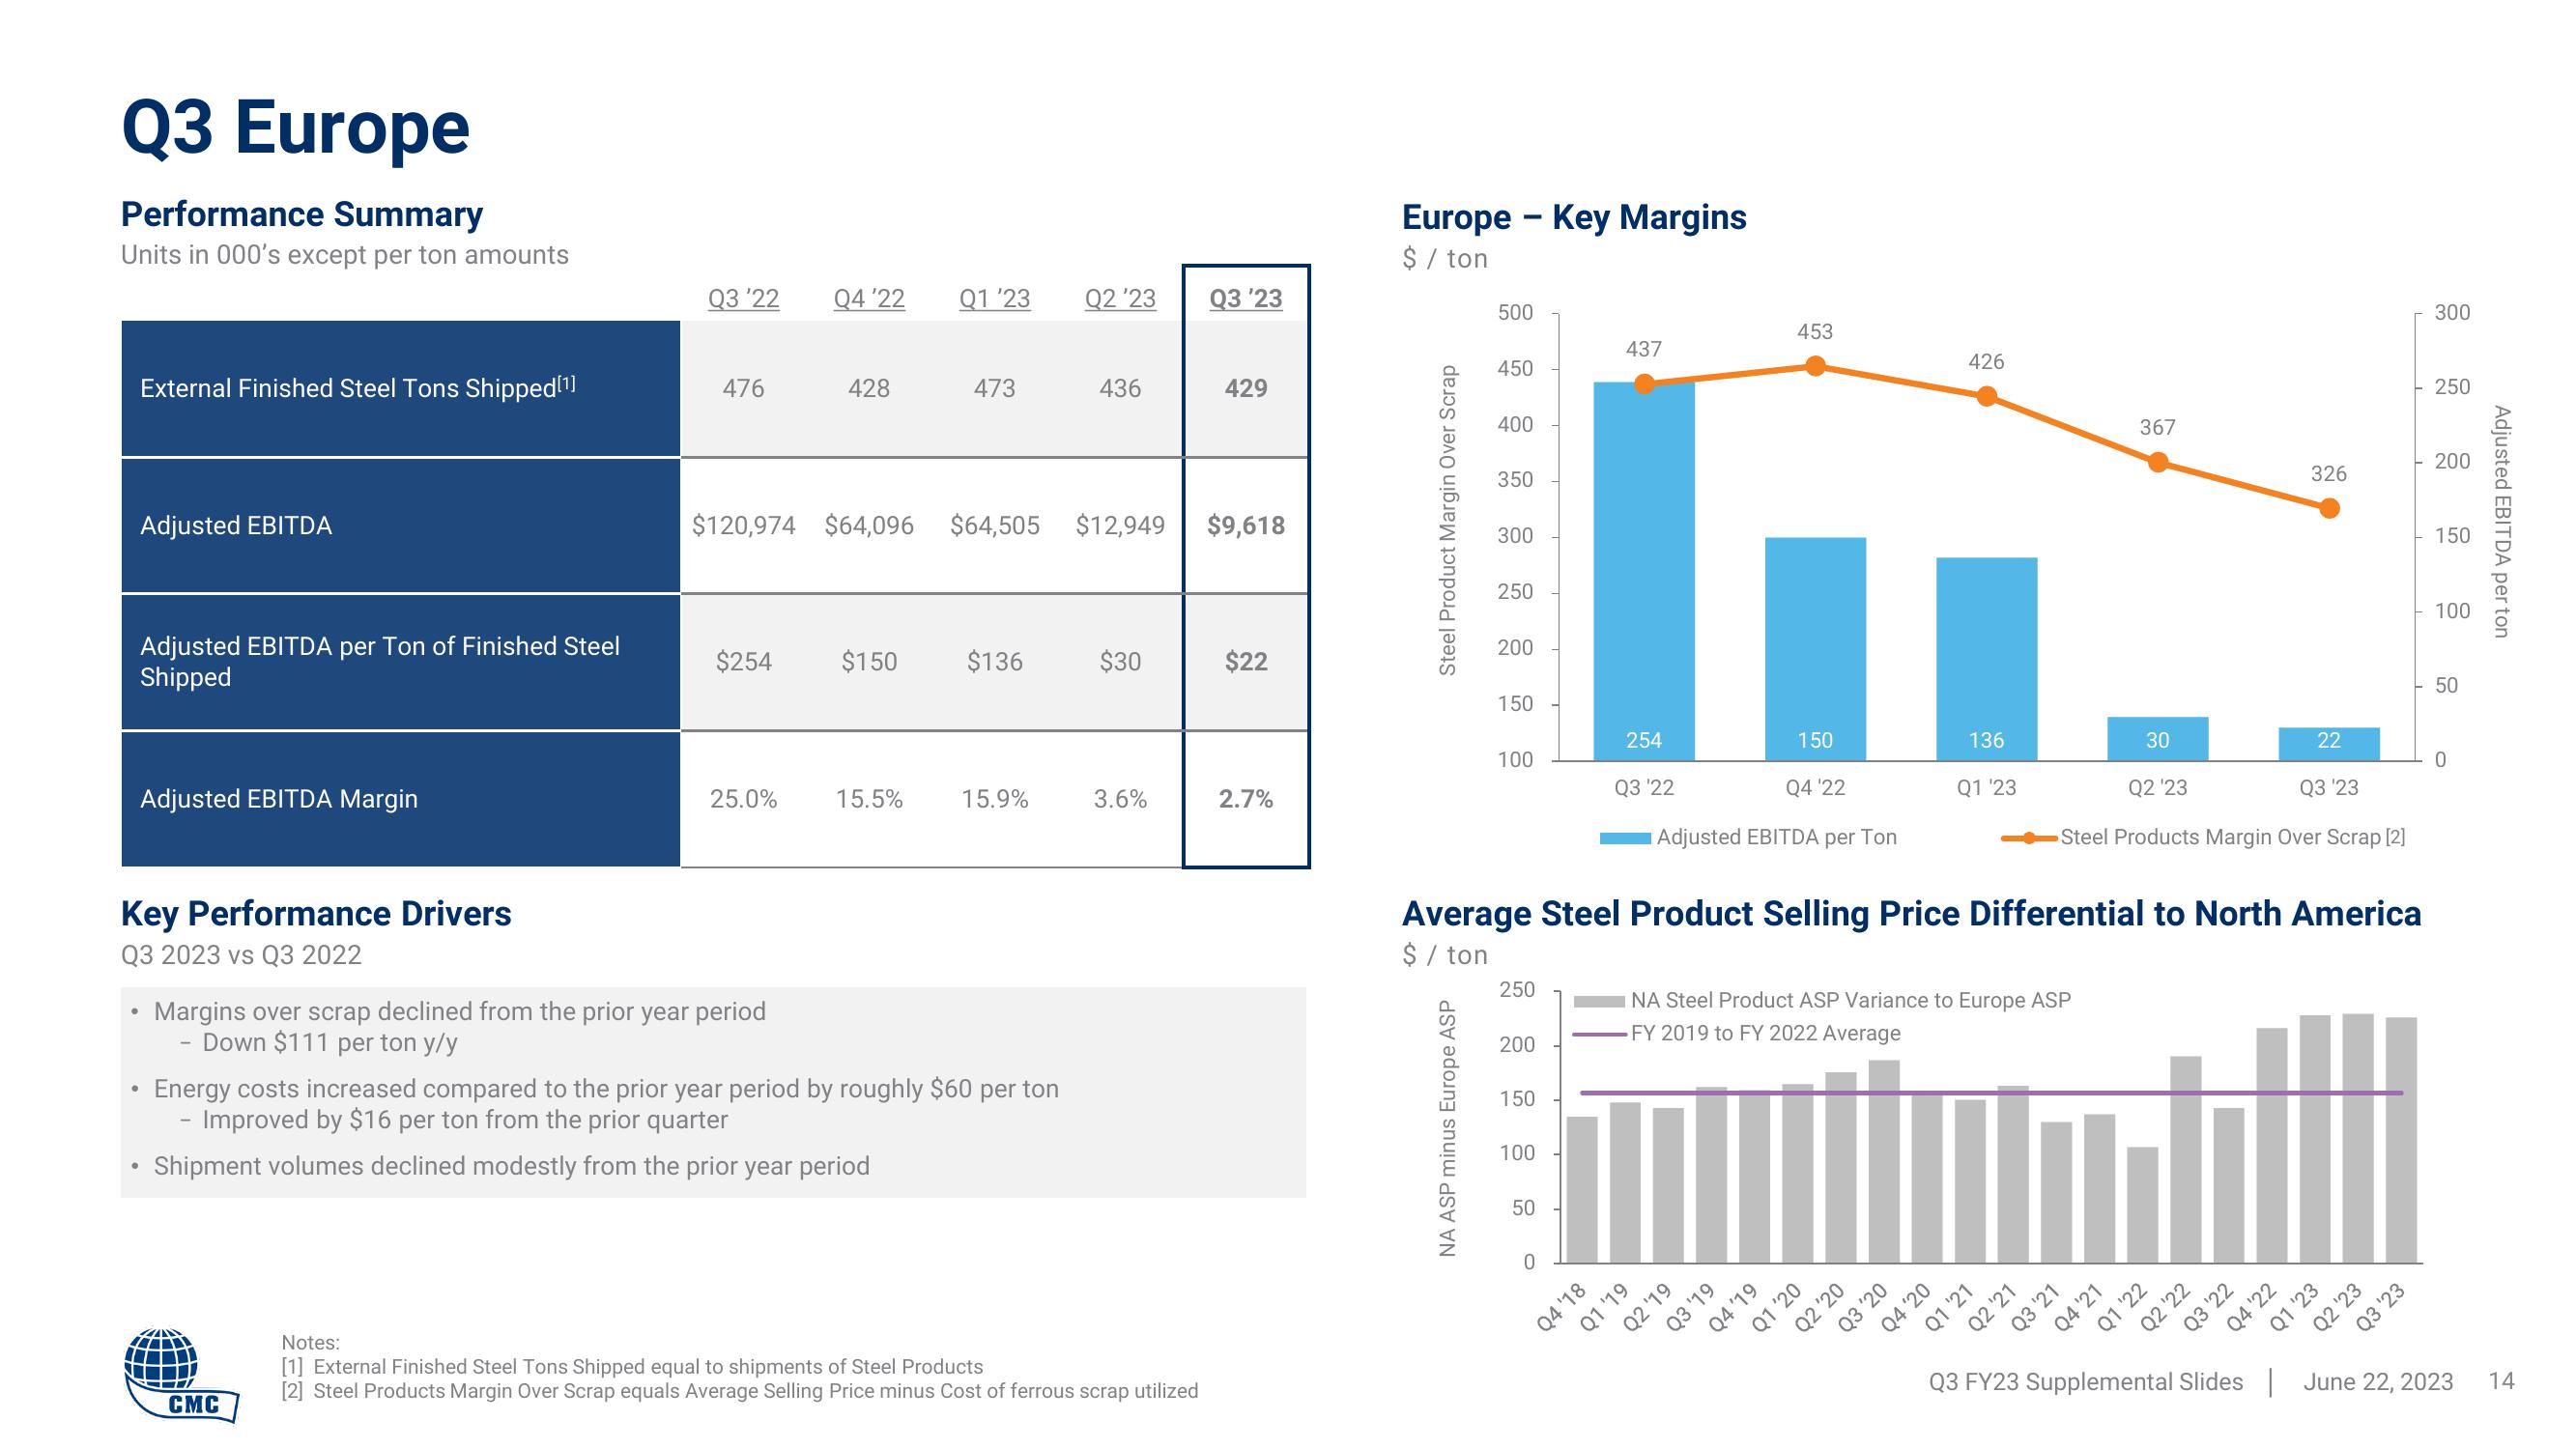
Margins over scrap declined from the prior year period
Down $111 per ton y/y
428
Q1 '23
$254 $150 $136
473
15.5%
$120,974 $64,096 $64,505 $12,949 $9,618
15.9%
Energy costs increased compared to the prior year period by roughly $60 per ton
Improved by $16 per ton from the prior quarter
Shipment volumes declined modestly from the prior year period
Q2 '23
436
$30
3.6%
Q3 '23
Notes:
[1] External Finished Steel Tons Shipped equal to shipments of Steel Products
[2] Steel Products Margin Over Scrap equals Average Selling Price minus Cost of ferrous scrap utilized
429
$22
2.7%
Europe - Key Margins
$ / ton
Steel Product Margin Over Scrap
500
NA ASP minus Europe ASP
450
400
350
300
250
200
150
100
250
200
150
100
50
437
0
254
Q3 '22
Q4 '18
Q1 '19
Q4 '22
Adjusted EBITDA per Ton
453
Average Steel Product Selling Price Differential to North America
$ / ton
Q2 '19
150
Q3 '19
Q4'19
NA Steel Product ASP Variance to Europe ASP
FY 2019 to FY 2022
Average
Q1 '20
Q2 '20
426
Q3 '20
136
Q4 '20
Q1 '23
Q1 '21
Q2 '21
367
Q3 '21
30
Q2 '23
Q3 '23
Steel Products Margin Over Scrap [2]
Q4 '21
Q1 '22
Q2 '22
326
Q3 '22
22
Q4 '22
Q1 '23
Q2 '23
Q3 '23
300
250
200
150
100
50
0
Q3 FY23 Supplemental Slides June 22, 2023
Adjusted EBITDA per ton
14View entire presentation