Confluent IPO Presentation Deck
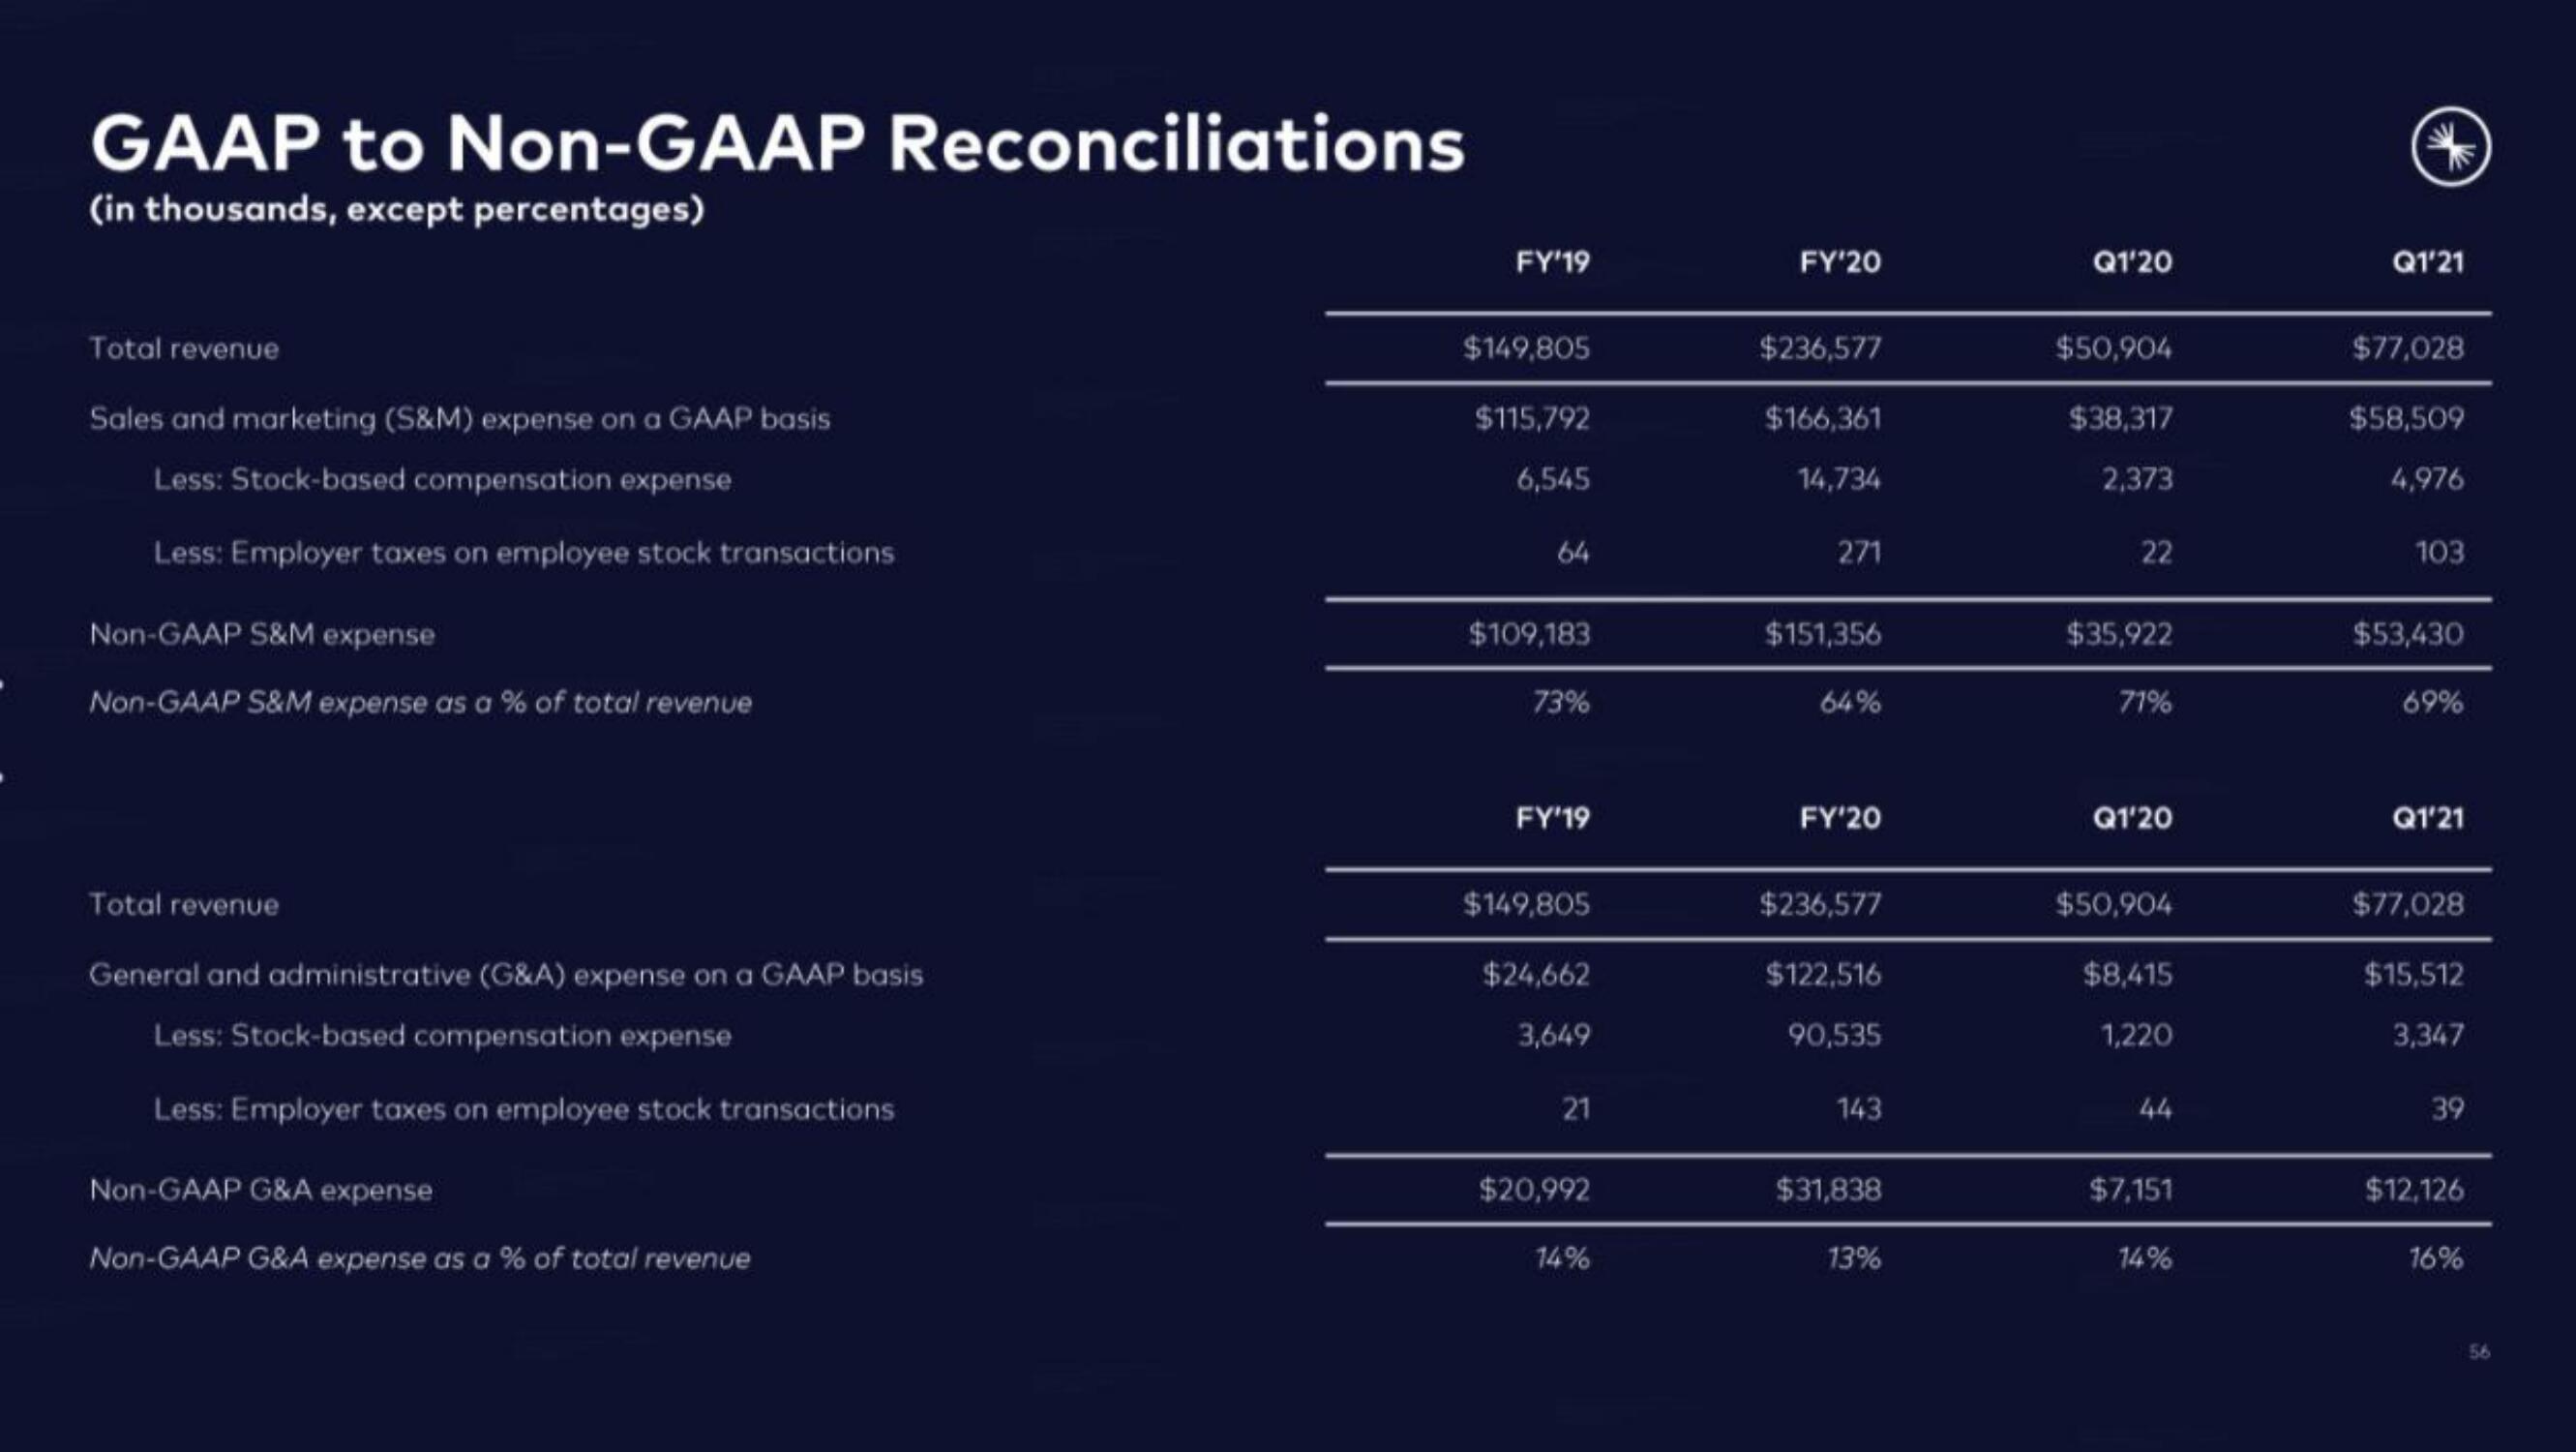
GAAP to Non-GAAP Reconciliations
(in thousands, except percentages)
Total revenue
Sales and marketing (S&M) expense on a GAAP basis
Less: Stock-based compensation expense
Less: Employer taxes on employee stock transactions
Non-GAAP S&M expense
Non-GAAP S&M expense as a % of total revenue
Total revenue
General and administrative (G&A) expense on a GAAP basis
Less: Stock-based compensation expense
Less: Employer taxes on employee stock transactions
Non-GAAP G&A expense
Non-GAAP G&A expense as a % of total revenue
FY'19
$149,805
$115,792
6,545
64
$109,183
73%
FY'19
$149,805
$24,662
3,649
21
$20,992
14%
FY'20
$236,577
$166,361
14,734
271
$151,356
64%
FY'20
$236,577
$122,516
90,535
143
$31,838
13%
Q1'20
$50,904
$38,317
2,373
22
$35,922
71%
Q1'20
$50,904
$8,415
1,220
44
$7,151
14%
Q1'21
$77,028
$58,509
4,976
103
$53,430
69%
Q1'21
$77,028
$15,512
3,347
39
$12,126
16%View entire presentation