Avantor Results Presentation Deck
5
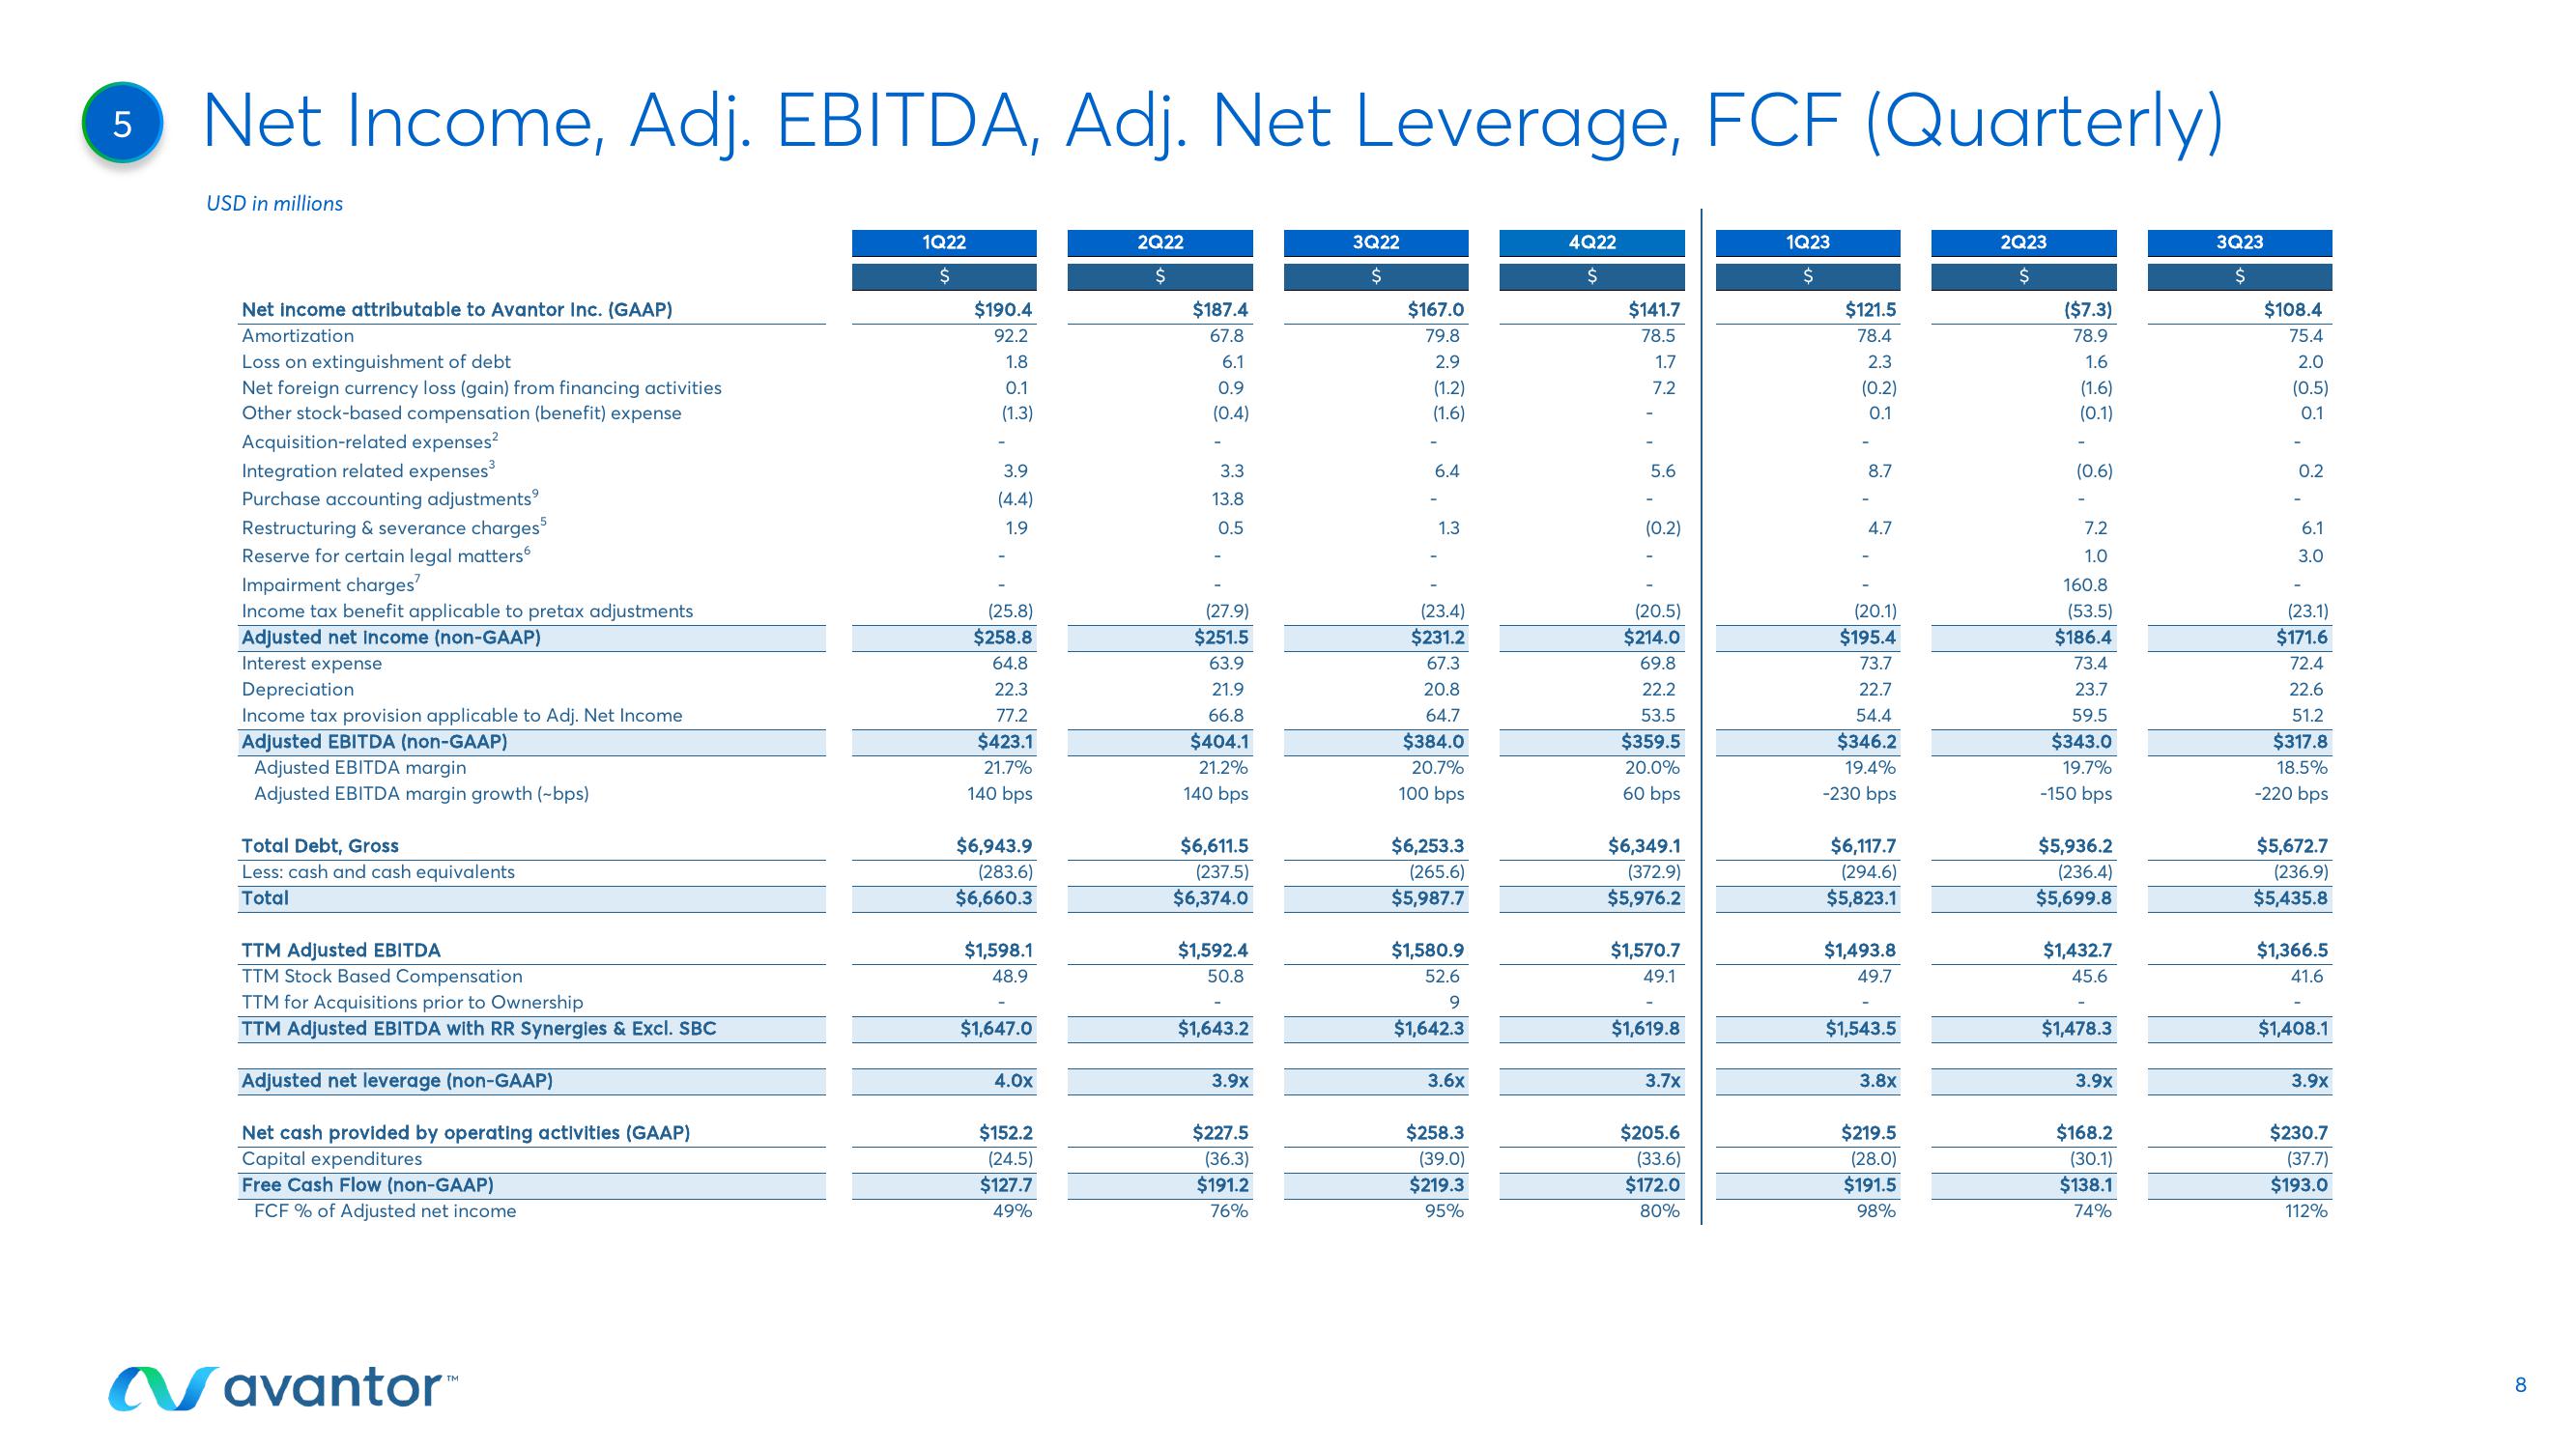
Net Income, Adj. EBITDA, Adj. Net Leverage, FCF (Quarterly)
USD in millions
Net income attributable to Avantor Inc. (GAAP)
Amortization
Loss on extinguishment of debt
Net foreign currency loss (gain) from financing activities
Other stock-based compensation (benefit) expense
Acquisition-related expenses²
Integration related expenses³
Purchase accounting adjustments
Restructuring & severance charges5
Reserve for certain legal matters
Impairment charges'
Income tax benefit applicable to pretax adjustments
Adjusted net income (non-GAAP)
Interest expense
Depreciation
Income tax provision applicable to Adj. Net Income
Adjusted EBITDA (non-GAAP)
Adjusted EBITDA margin
Adjusted EBITDA margin growth (-bps)
Total Debt, Gross
Less: cash and cash equivalents
Total
TTM Adjusted EBITDA
TTM Stock Based Compensation
TTM for Acquisitions prior to Ownership
TTM Adjusted EBITDA with RR Synergies & Excl. SBC
Adjusted net leverage (non-GAAP)
Net cash provided by operating activities (GAAP)
Capital expenditures
Free Cash Flow (non-GAAP)
FCF % of Adjusted net income
avantor™
1Q22
$
$190.4
92.2
1.8
0.1
(1.3)
-
3.9
(4.4)
1.9
(25.8)
$258.8
64.8
22.3
77.2
$423.1
21.7%
140 bps
$6,943.9
(283.6)
$6,660.3
$1,598.1
48.9
$1,647.0
4.0x
$152.2
(24.5)
$127.7
49%
2Q22
$
$187.4
67.8
6.1
0.9
(0.4)
-
3.3
13.8
0.5
(27.9)
$251.5
63.9
21.9
66.8
$404.1
21.2%
140 bps
$6,611.5
(237.5)
$6,374.0
$1,592.4
50.8
$1,643.2
3.9x
$227.5
(36.3)
$191.2
76%
3Q22
$
$167.0
79.8
2.9
(1.2)
(1.6)
-
6.4
1.3
(23.4)
$231.2
67.3
20.8
64.7
$384.0
20.7%
100 bps
$6,253.3
(265.6)
$5,987.7
$1,580.9
52.6
9
$1,642.3
3.6x
$258.3
(39.0)
$219.3
95%
4Q22
$
$141.7
78.5
1.7
7.2
5.6
-
(0.2)
(20.5)
$214.0
69.8
22.2
53.5
$359.5
20.0%
60 bps
$6,349.1
(372.9)
$5,976.2
$1,570.7
49.1
$1,619.8
3.7x
$205.6
(33.6)
$172.0
80%
1Q23
$
$121.5
78.4
2.3
(0.2)
0.1
-
8.7
4.7
(20.1)
$195.4
73.7
22.7
54.4
$346.2
19.4%
-230 bps
$6,117.7
(294.6)
$5,823.1
$1,493.8
49.7
$1,543.5
3.8x
$219.5
(28.0)
$191.5
98%
2Q23
$
($7.3)
78.9
1.6
(1.6)
(0.1)
-
(0.6)
-
7.2
1.0
160.8
(53.5)
$186.4
73.4
23.7
59.5
$343.0
19.7%
-150 bps
$5,936.2
(236.4)
$5,699.8
$1,432.7
45.6
$1,478.3
3.9x
$168.2
(30.1)
$138.1
74%
3Q23
$
$108.4
75.4
2.0
(0.5)
0.1
-
0.2
6.1
3.0
(23.1)
$171.6
72.4
22.6
51.2
$317.8
18.5%
-220 bps
$5,672.7
(236.9)
$5,435.8
$1,366.5
41.6
$1,408.1
3.9x
$230.7
(37.7)
$193.0
112%
8View entire presentation