KKR Real Estate Finance Trust Results Presentation Deck
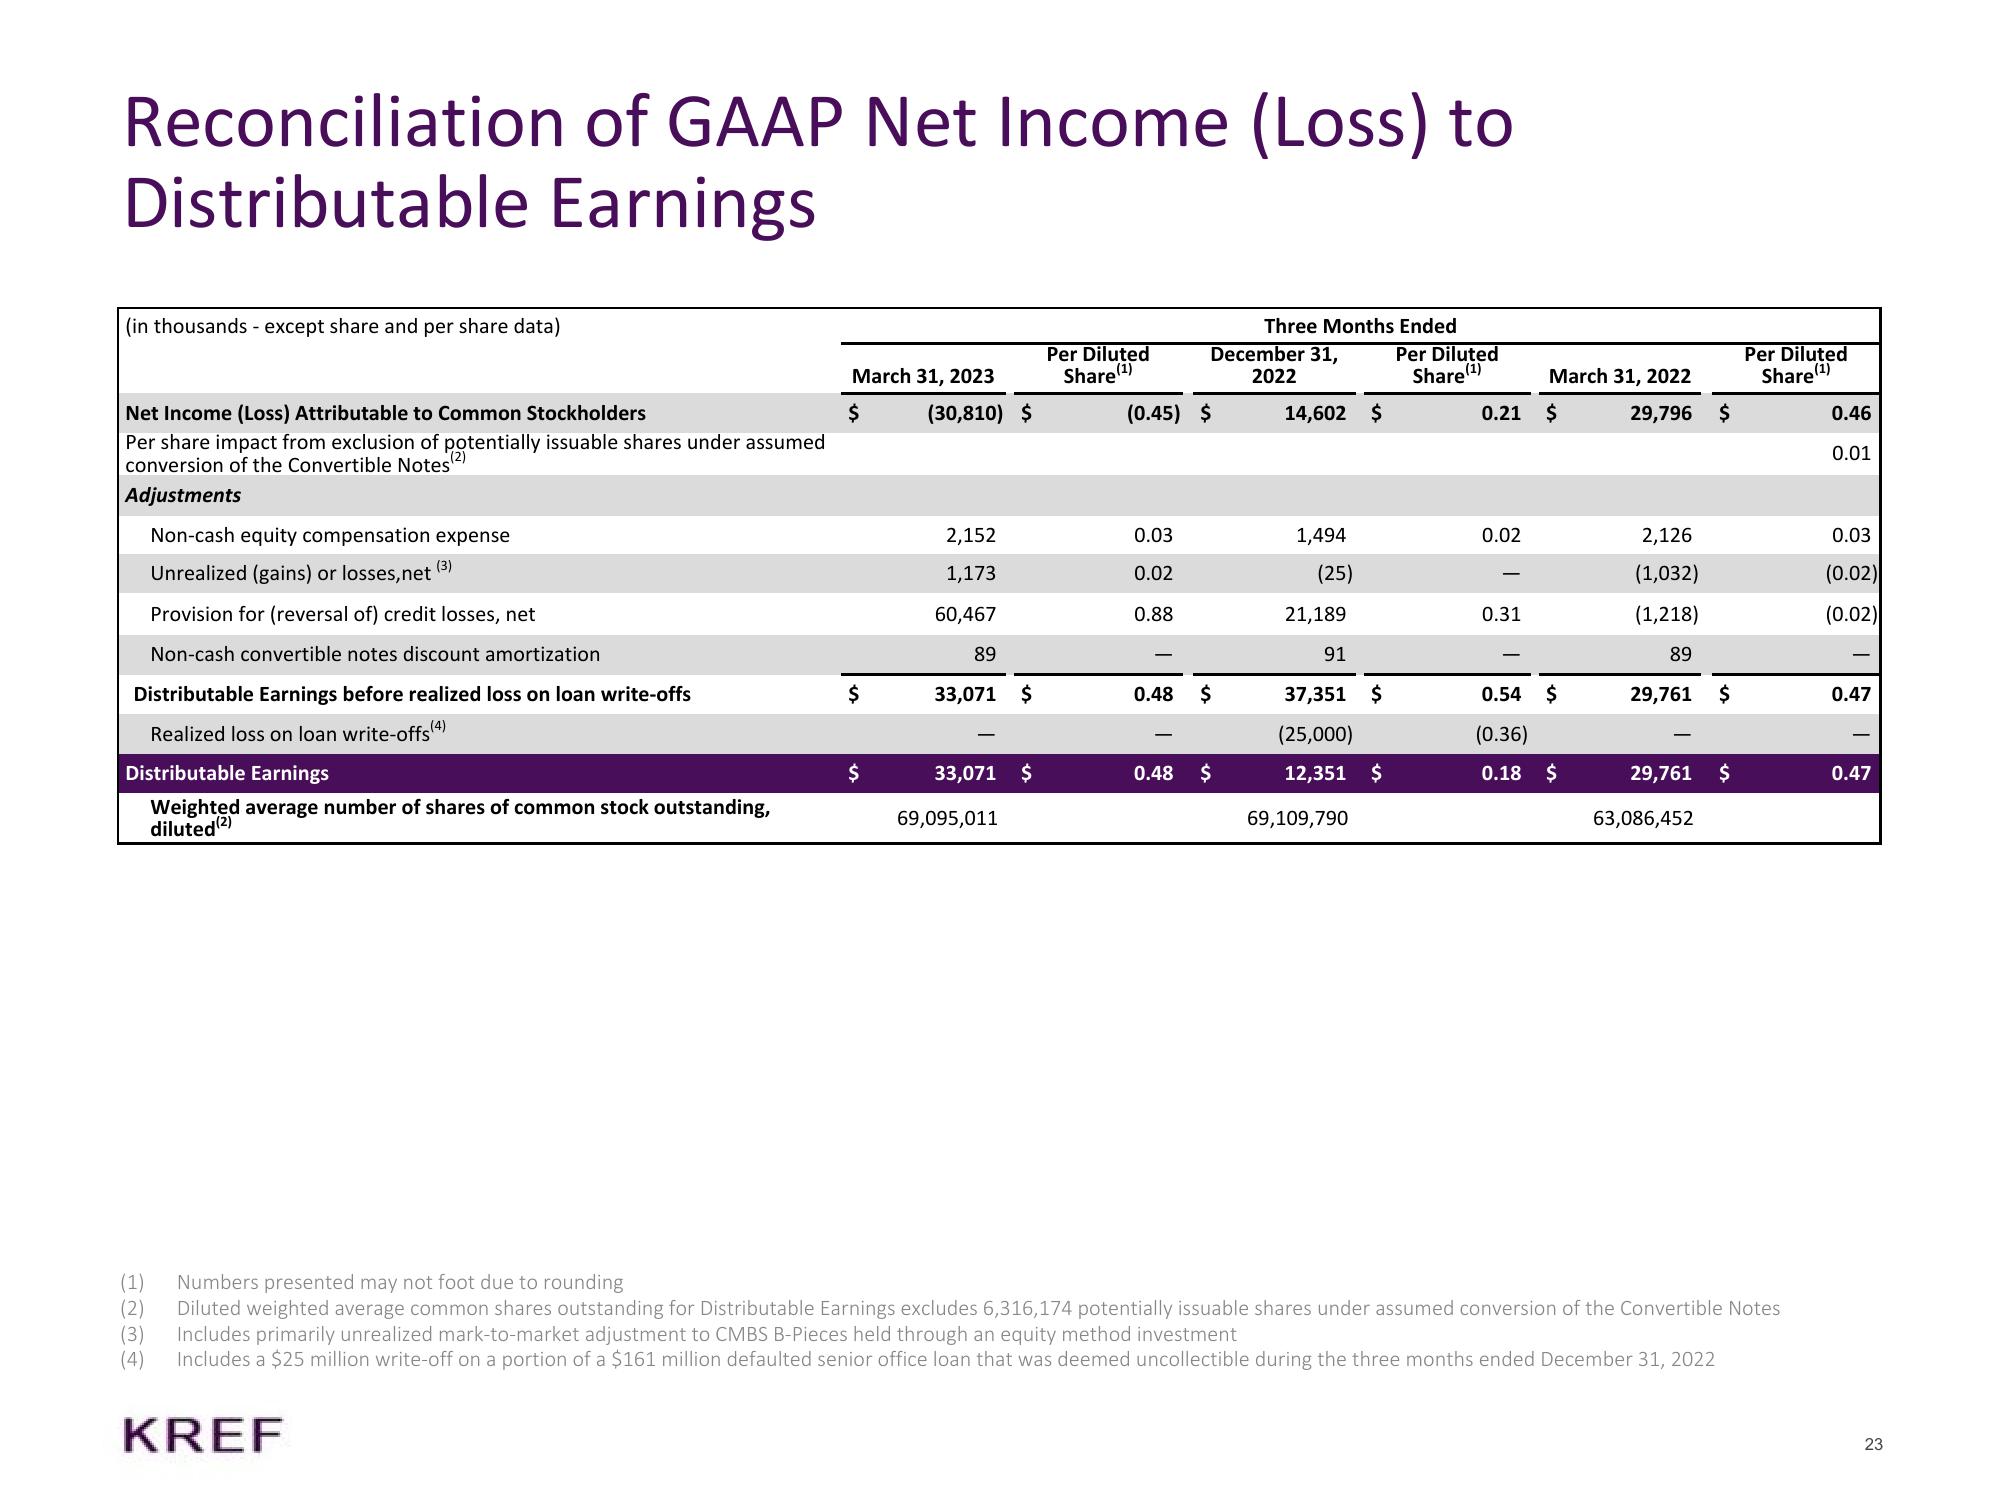
Reconciliation of GAAP Net Income (Loss) to
Distributable Earnings
(in thousands - except share and per share data)
Net Income (Loss) Attributable to Common Stockholders
Per share impact from exclusion of potentially issuable shares under assumed
conversion of the Convertible Notes (²)
Adjustments
Non-cash equity compensation expense
Unrealized (gains) or losses, net
(3)
Provision for (reversal of) credit losses, net
Non-cash convertible notes discount amortization
Distributable Earnings before realized loss on loan write-offs
Realized loss on loan write-offs(4)
Distributable Earnings
Weighted average number of shares of common stock outstanding,
diluted (2)
(1)
(3)
(4)
March 31, 2023
$
KREF
$
$
(30,810) $
2,152
1,173
60,467
89
33,071 $
33,071 $
69,095,011
Per Diluted
Share (¹)
(0.45) $
0.03
0.02
0.88
December 31,
2022
0.48 $
Three Months Ended
Per Diluted
Share (¹)
0.48 $
14,602 $
1,494
(25)
21,189
91
37,351 $
(25,000)
12,351 $
69,109,790
0.21 $
0.02
March 31, 2022
0.31
0.54
(0.36)
0.18 $
$
29,796 $
2,126
(1,032)
(1,218)
89
29,761 $
29,761 $
63,086,452
Per Diluted
Share (¹)
Numbers presented may not foot due to rounding
Diluted weighted average common shares outstanding for Distributable Earnings excludes 6,316,174 potentially issuable shares under assumed conversion of the Convertible Notes
Includes primarily unrealized mark-to-market adjustment to CMBS B-Pieces held through an equity method investment
Includes a $25 million write-off on a portion of a $161 million defaulted senior office loan that was deemed uncollectible during the three months ended December 31, 2022
0.46
0.01
0.03
(0.02)
(0.02)
0.47
0.47
23View entire presentation