J.P.Morgan 2Q23 Investor Results
JPMORGAN CHASE & CO.
NON-GAAP FINANCIAL MEASURES
JPMORGAN CHASE & CO.
Non-GAAP Financial Measures
(a) In addition to analyzing the Firm's results on a reported basis, management reviews Firmwide results, including the overhead ratio, on a "managed" basis; these Firmwide managed
basis results are non-GAAP financial measures. The Firm also reviews the results of the lines of business on a managed basis. The Firm's definition of managed basis starts, in each
case, with the reported U.S. GAAP results and includes certain reclassifications to present total net revenue for the Firm and each of the reportable business segments on an FTE
basis. Accordingly, revenue from investments that receive tax credits and tax-exempt securities is presented in the managed results on a basis comparable to taxable investments and
securities. These financial measures allow management to assess the comparability of revenue from year-to-year arising from both taxable and tax-exempt sources. The corresponding
income tax impact related to tax-exempt items is recorded within income tax expense. These adjustments have no impact on net income as reported by the Firm as a whole or by the
lines of business.
(b) Pre-provision profit is a non-GAAP financial measure which represents total net revenue less total noninterest expense. The Firm believes that this financial measure is useful in
assessing the ability of a lending institution to generate income in excess of its provision for credit losses.
(c)
TCE, ROTCE, and TBVPS are each non-GAAP financial measures. TCE represents the Firm's common stockholders' equity (i.e., total stockholders' equity less preferred stock) less
goodwill and identifiable intangible assets (other than MSRs), net of related deferred tax liabilities. ROTCE measures the Firm's net income applicable to common equity as a
percentage of average TCE. TBVPS represents the Firm's TCE at period-end divided by common shares at period-end. TCE, ROTCE, and TBVPS are utilized by the Firm, as well as
investors and analysts, in assessing the Firm's use of equity.
(d) The ratio of the wholesale and CIB's allowance for loan losses to period-end loans retained, excluding trade finance and conduits, is calculated excluding loans accounted for at
fair value, loans held-for-sale, CIB's trade finance loans and consolidated Firm-administered multi-seller conduits, as well as their related allowances, to provide a more meaningful
assessment of the respective allowance coverage ratio.
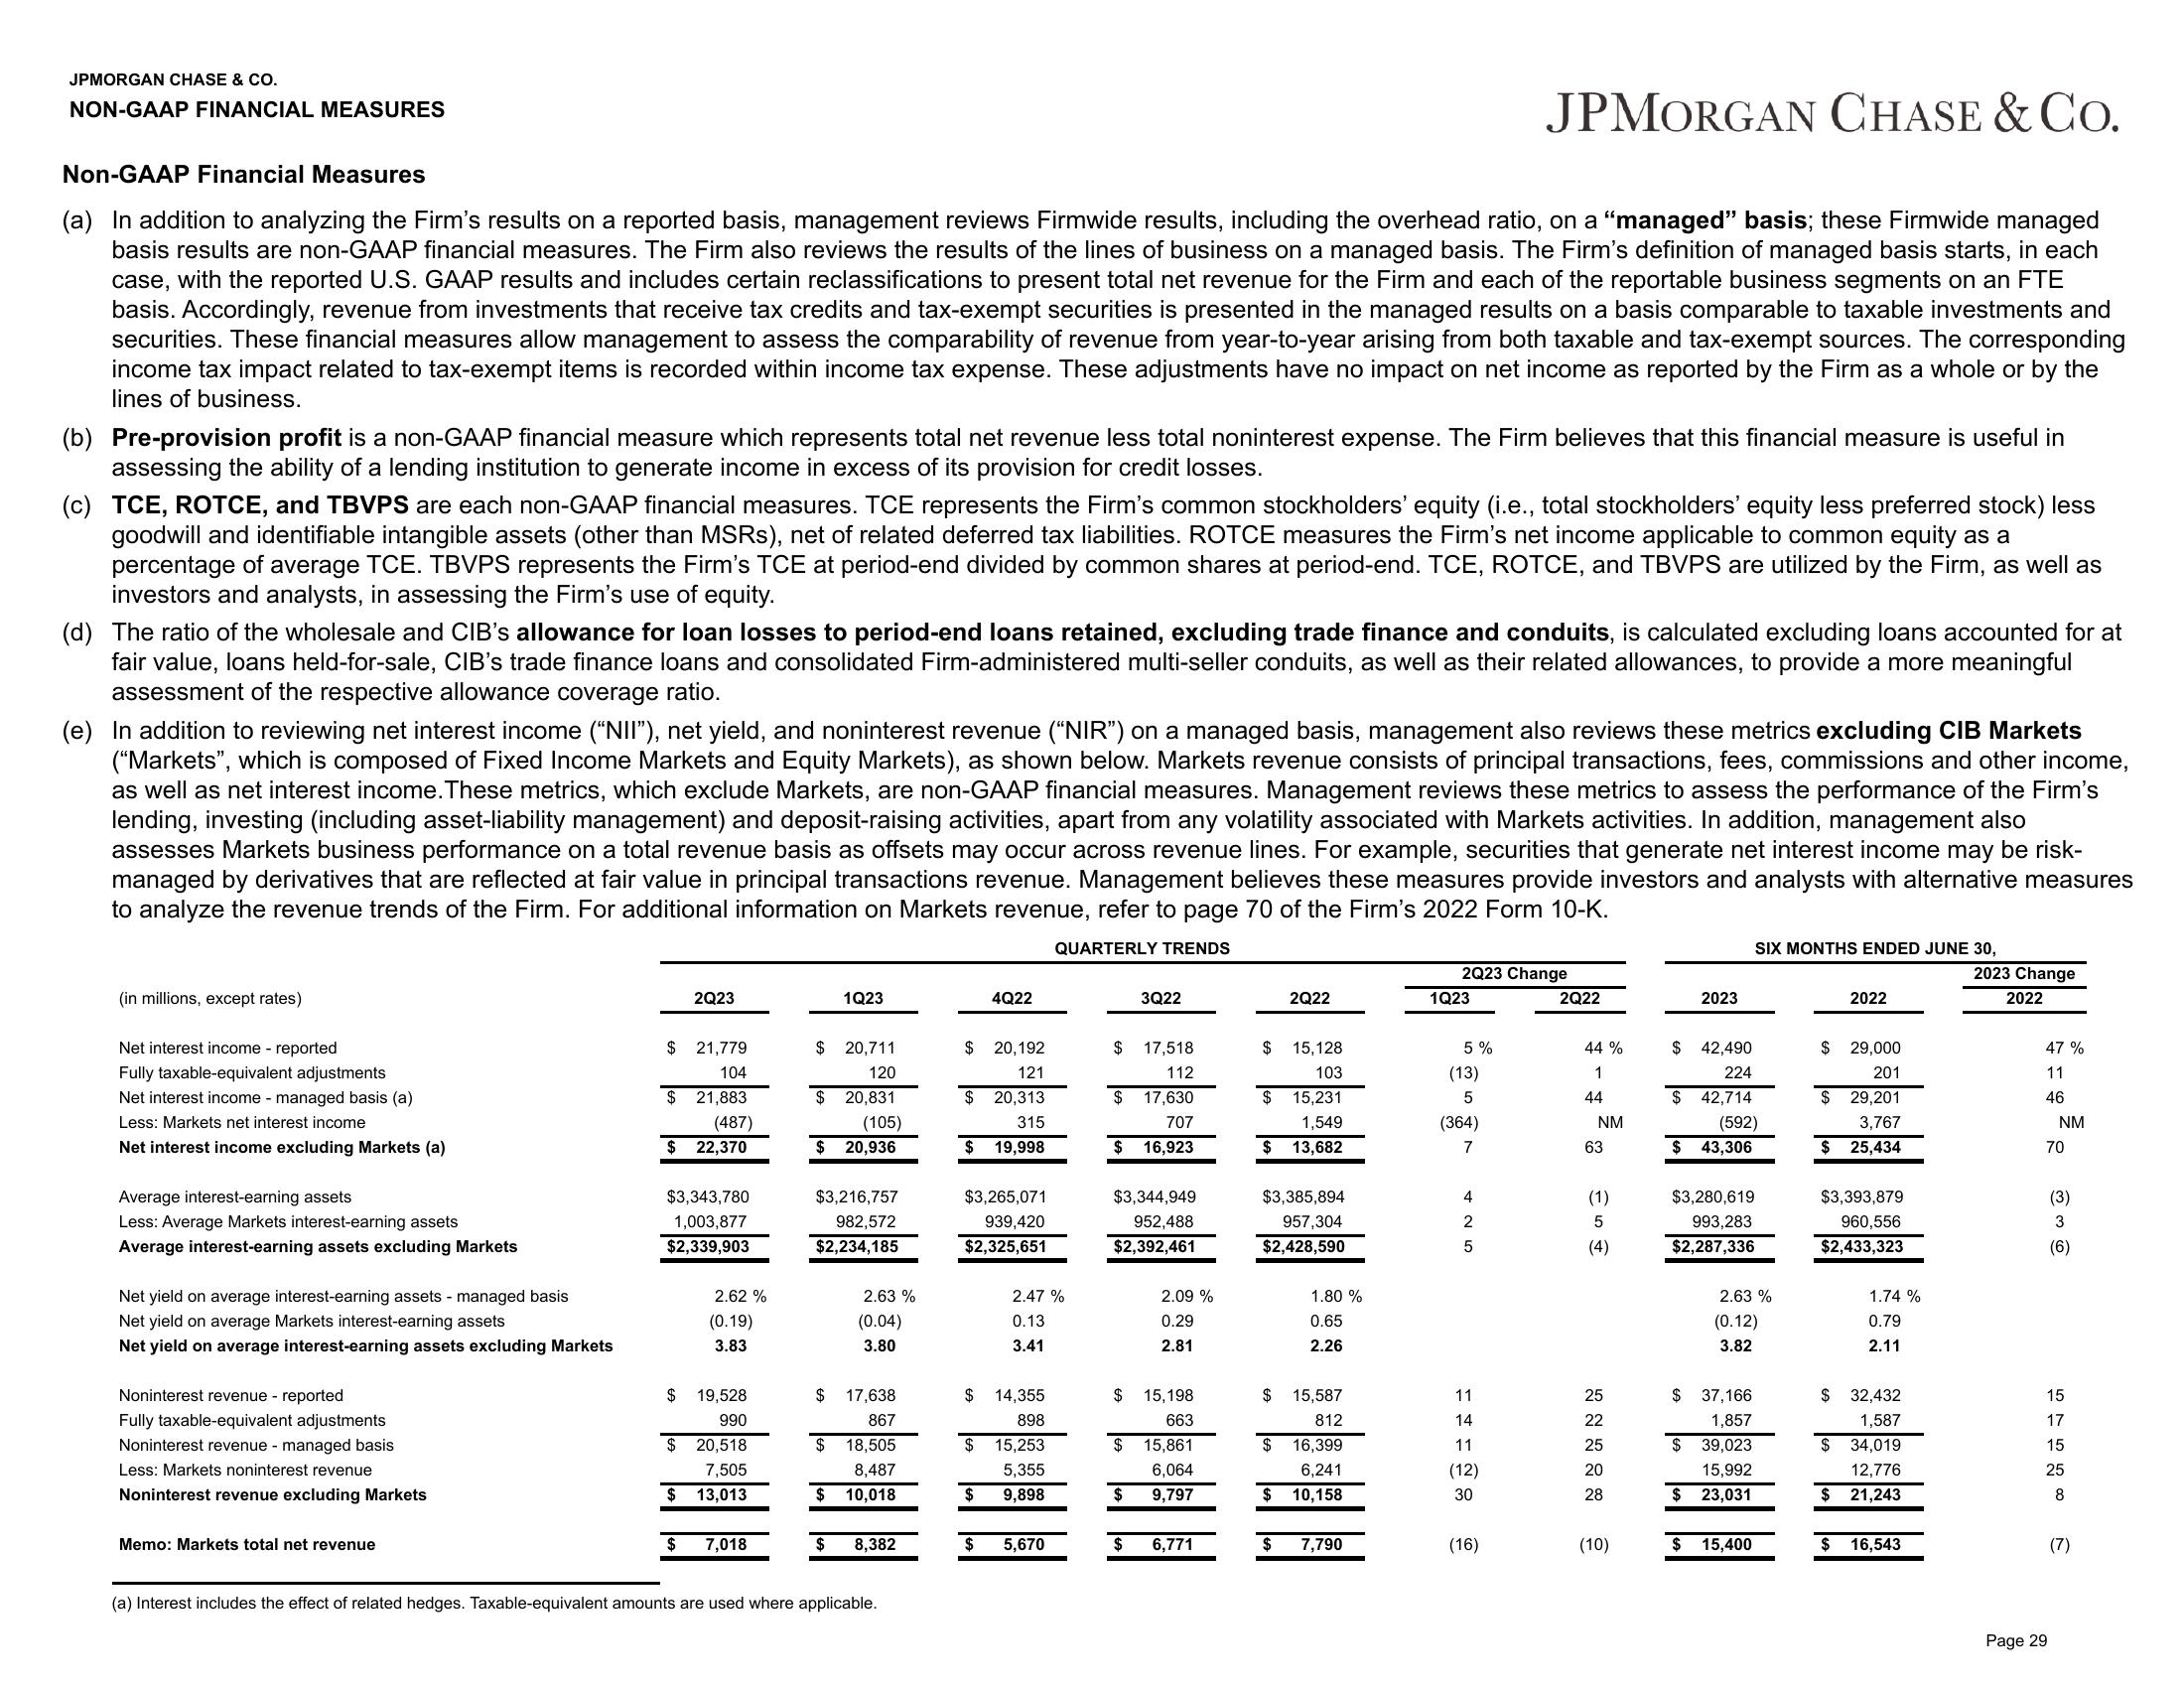
(e) In addition to reviewing net interest income ("NII"), net yield, and noninterest revenue ("NIR") on a managed basis, management also reviews these metrics excluding CIB Markets
("Markets", which is composed of Fixed Income Markets and Equity Markets), as shown below. Markets revenue consists of principal transactions, fees, commissions and other income,
as well as net interest income. These metrics, which exclude Markets, are non-GAAP financial measures. Management reviews these metrics to assess the performance of the Firm's
lending, investing (including asset-liability management) and deposit-raising activities, apart from any volatility associated with Markets activities. In addition, management also
assesses Markets business performance on a total revenue basis as offsets may occur across revenue lines. For example, securities that generate net interest income may be risk-
managed by derivatives that are reflected at fair value in principal transactions revenue. Management believes these measures provide investors and analysts with alternative measures
to analyze the revenue trends of the Firm. For additional information on Markets revenue, refer to page 70 of the Firm's 2022 Form 10-K.
QUARTERLY TRENDS
(in millions, except rates)
Net interest income - reported
Fully taxable-equivalent adjustments
Net interest income - managed basis (a)
Less: Markets net interest income
Net interest income excluding Markets (a)
Average interest-earning assets
Less: Average Markets interest-earning assets
Average interest-earning assets excluding Markets
Net yield on average interest-earning assets - managed basis
Net yield on average Markets interest-earning assets
Net yield on average interest-earning assets excluding Markets
Noninterest revenue - reported
Fully taxable-equivalent adjustments
Noninterest revenue - managed basis
Less: Markets noninterest revenue
Noninterest revenue excluding Markets
Memo: Markets total net revenue
2Q23
$ 21,779
104
$21,883
(487)
$22,370
$3,343,780
1,003,877
$2,339,903
2.62 %
(0.19)
3.83
$ 19,528
990
$ 20,518
7,505
$ 13,013
$ 7,018
$
20,711
120
$ 20,831
(105)
$ 20,936
1Q23
$3,216,757
982,572
$2,234,185
$ 17,638
867
$
2.63 %
(0.04)
3.80
$ 18,505
8,487
10,018
$
8,382
(a) Interest includes the effect of related hedges. Taxable-equivalent amounts are used where applicable.
$ 20,192
121
$ 20,313
315
19,998
$
4Q22
$3,265,071
939,420
$2,325,651
$ 14,355
898
$
2.47%
0.13
3.41
$ 15,253
5,355
9,898
$
5,670
$ 17,518
112
17,630
707
$ 16,923
$
$3,344,949
952,488
$2,392,461
3Q22
$
$ 15,198
663
15,861
6,064
9,797
$
$
2.09 %
0.29
2.81
6,771
$ 15,128
103
$
$
2Q22
$3,385,894
957,304
$2,428,590
$
15,231
1,549
13,682
$
$ 15,587
812
$ 16,399
6,241
10,158
1.80 %
0.65
2.26
7,790
2Q23 Change
1Q23
5%
(13)
5
(364)
7
4
2
5
11
14
11
(12)
30
(16)
2Q22
44 %
1
44
NM
63
(1)
5
(4)
25
22
25
20
28
(10)
$
$ 42,490
224
42,714
(592)
43,306
$
2023
$3,280,619
993,283
$2,287,336
$
$ 37,166
1,857
$ 39,023
15,992
$ 23,031
SIX MONTHS ENDED JUNE 30,
2.63 %
(0.12)
3.82
15,400
$ 29,000
201
$ 29,201
3,767
25,434
$
2022
$3,393,879
960,556
$2,433,323
$
32,432
1,587
34,019
12,776
$ 21,243
$
1.74%
0.79
2.11
$ 16,543
2023 Change
2022
47%
11
46
NM
70
Page 29
(3)
3
(6)
15
17
15
25
8
(7)View entire presentation