IGI SPAC Presentation Deck
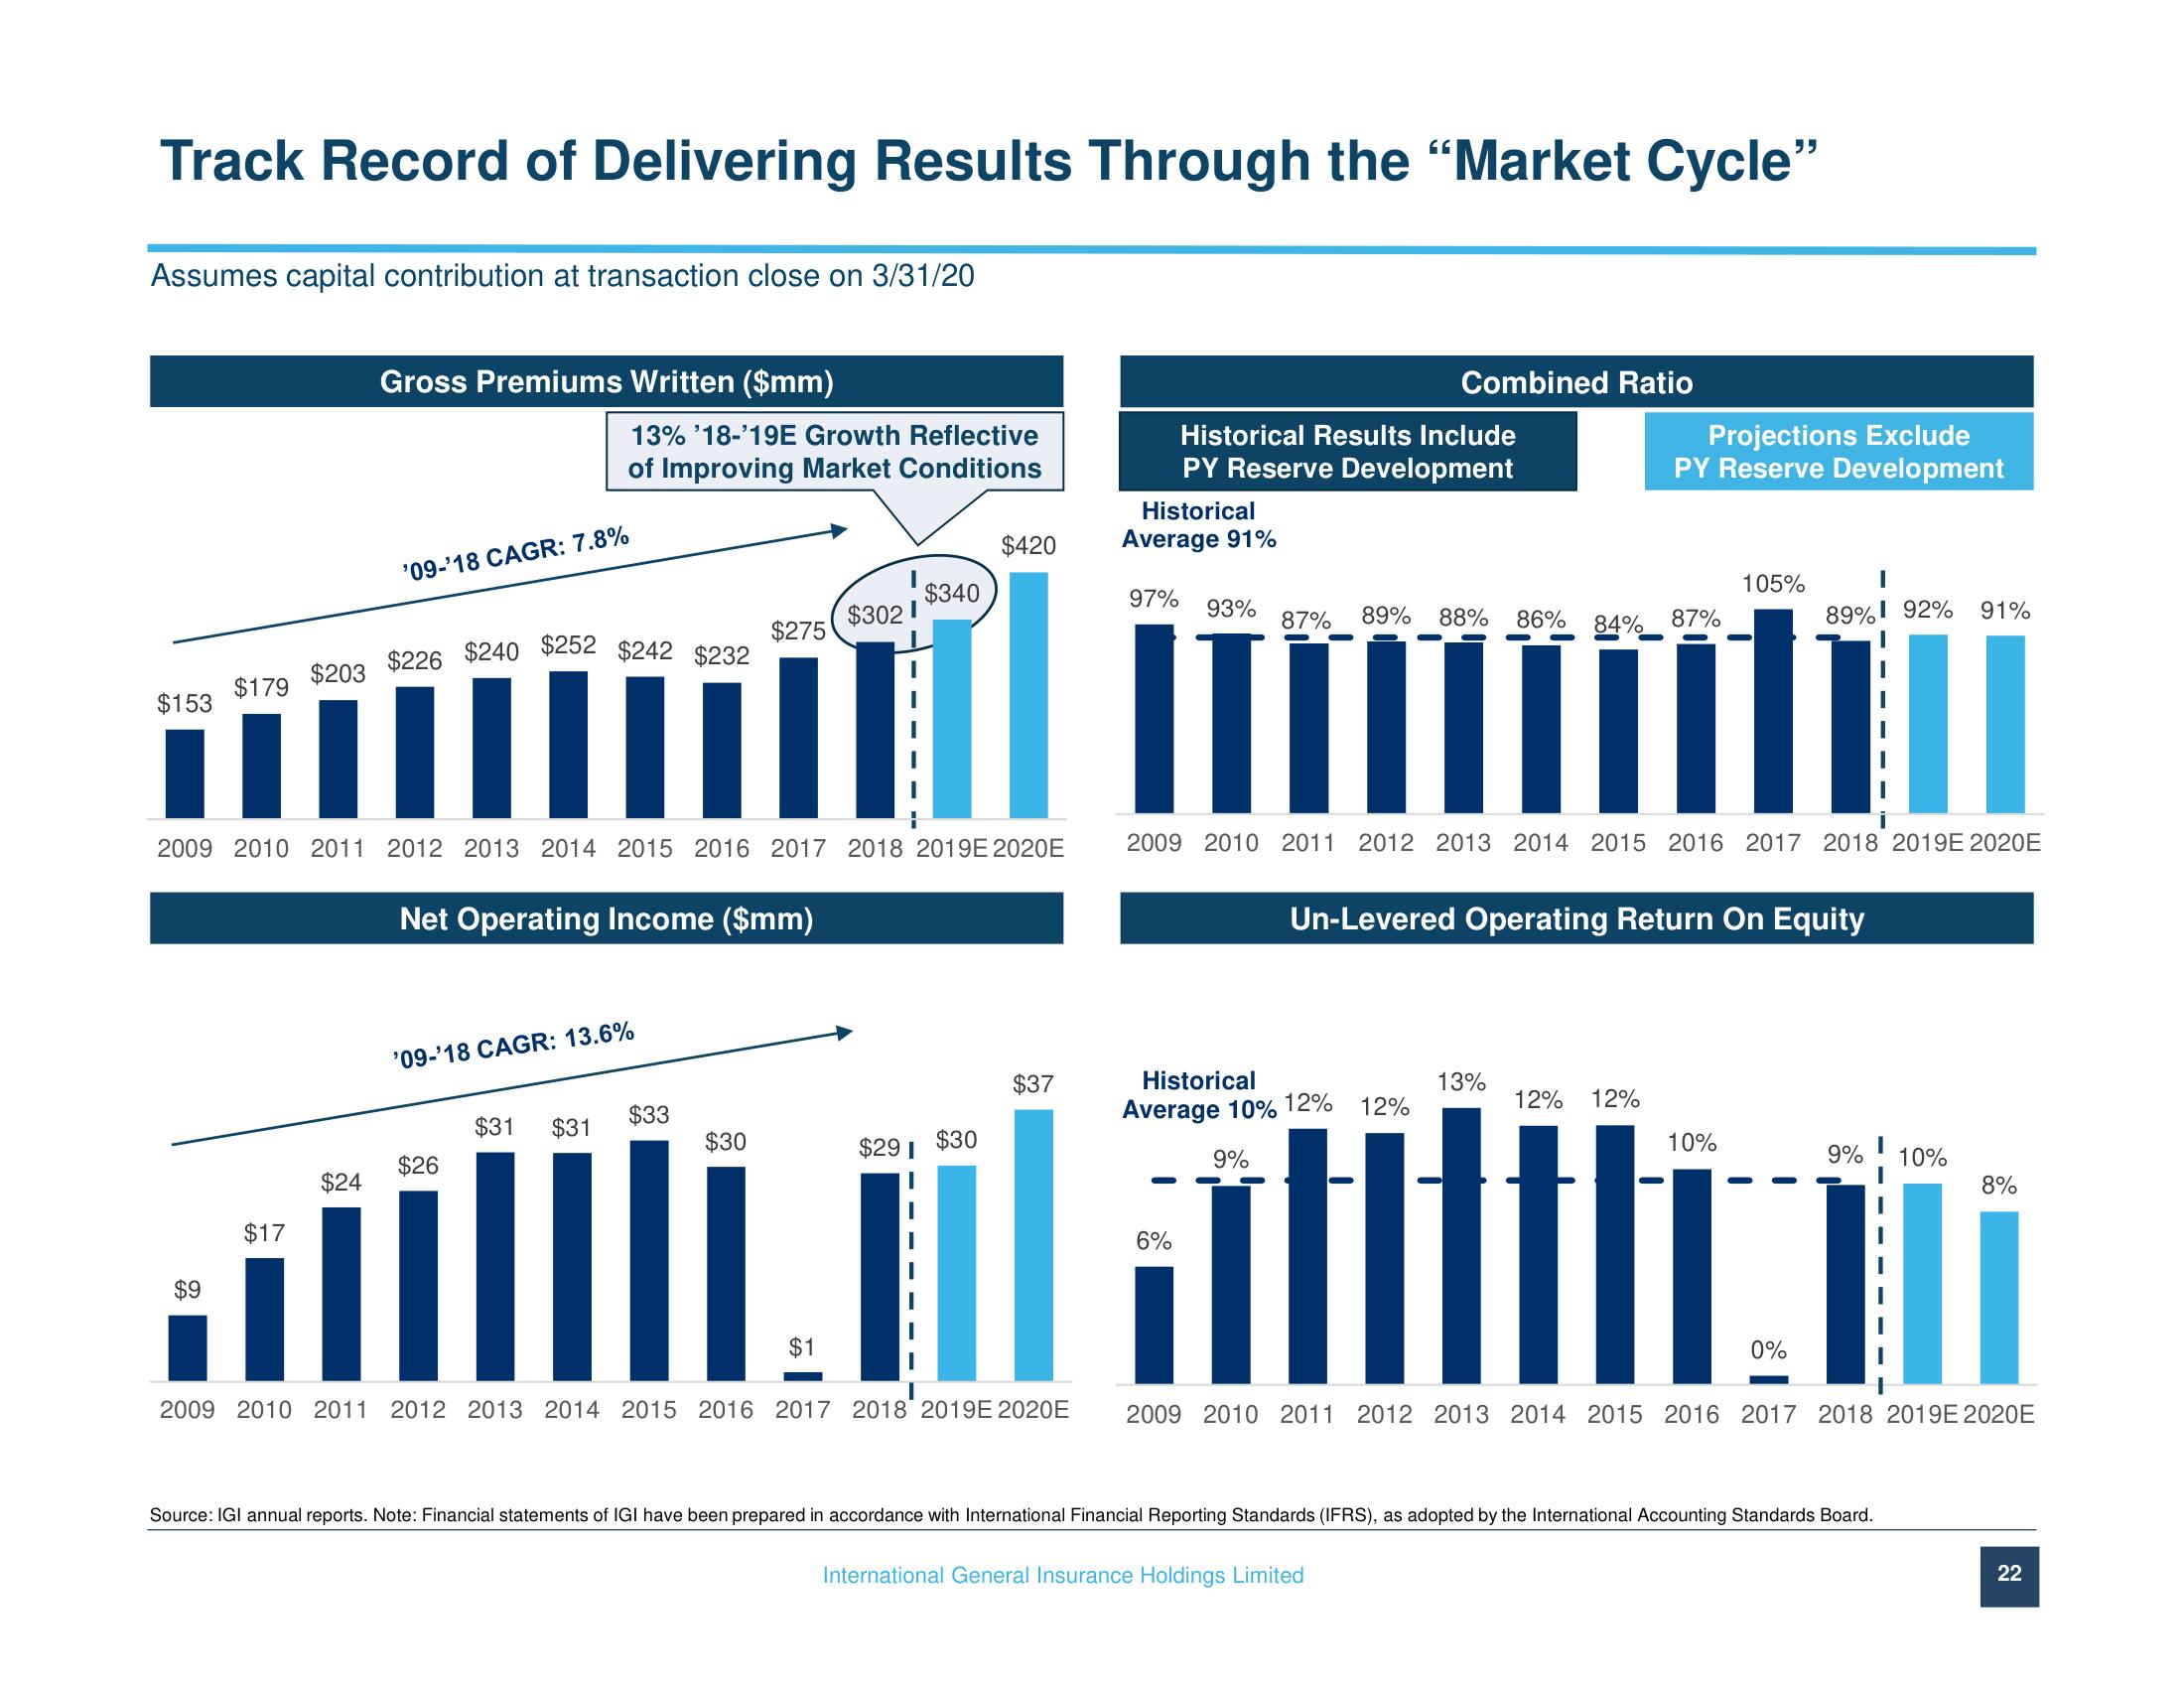
Track Record of Delivering Results Through the "Market Cycle"
Assumes capital contribution at transaction close on 3/31/20
$153
$179
$9
$203
$17
Gross Premiums Written ($mm)
$252 $242 $232
$226 $240
11 III
2009 2010 2011 2012 2013 2014 2015 2016 2017 2018 2019E 2020E
'09-'18 CAGR: 7.8%
$24
13% '18-'19E Growth Reflective
of Improving Market Conditions
Net Operating Income ($mm)
'09-'18 CAGR: 13.6%
$26
$31 $31
$275
$33
$30
$420
$340
il
$302
$1
$291
Historical
Average 91%
97%
Historical Results Include
PY Reserve Development
93%
6%
87% 89% 88%
Combined Ratio
Historical
Average 10% 12%
9%
$37
$30
il
2009 2010 2011 2012 2013 2014 2015 2016 2017 2018 2019E 2020E 2009 2010 2011 2012 2013 2014 2015 2016 2017 2018 2019E 2020E
86%
12%
International General Insurance Holdings Limited
13%
I
89% 92%
mou
84%
2009 2010 2011 2012 2013 2014 2015 2016 2017 2018 2019E 2020E
Projections Exclude
PY Reserve Development
Un-Levered Operating Return On Equity
87%
12% 12%
105%
10%
0%
9%
Source: IGI annual reports. Note: Financial statements of IGI have been prepared in accordance with International Financial Reporting Standards (IFRS), as adopted by the International Accounting Standards Board.
91%
10%
8%
22View entire presentation