BioNTech Results Presentation Deck
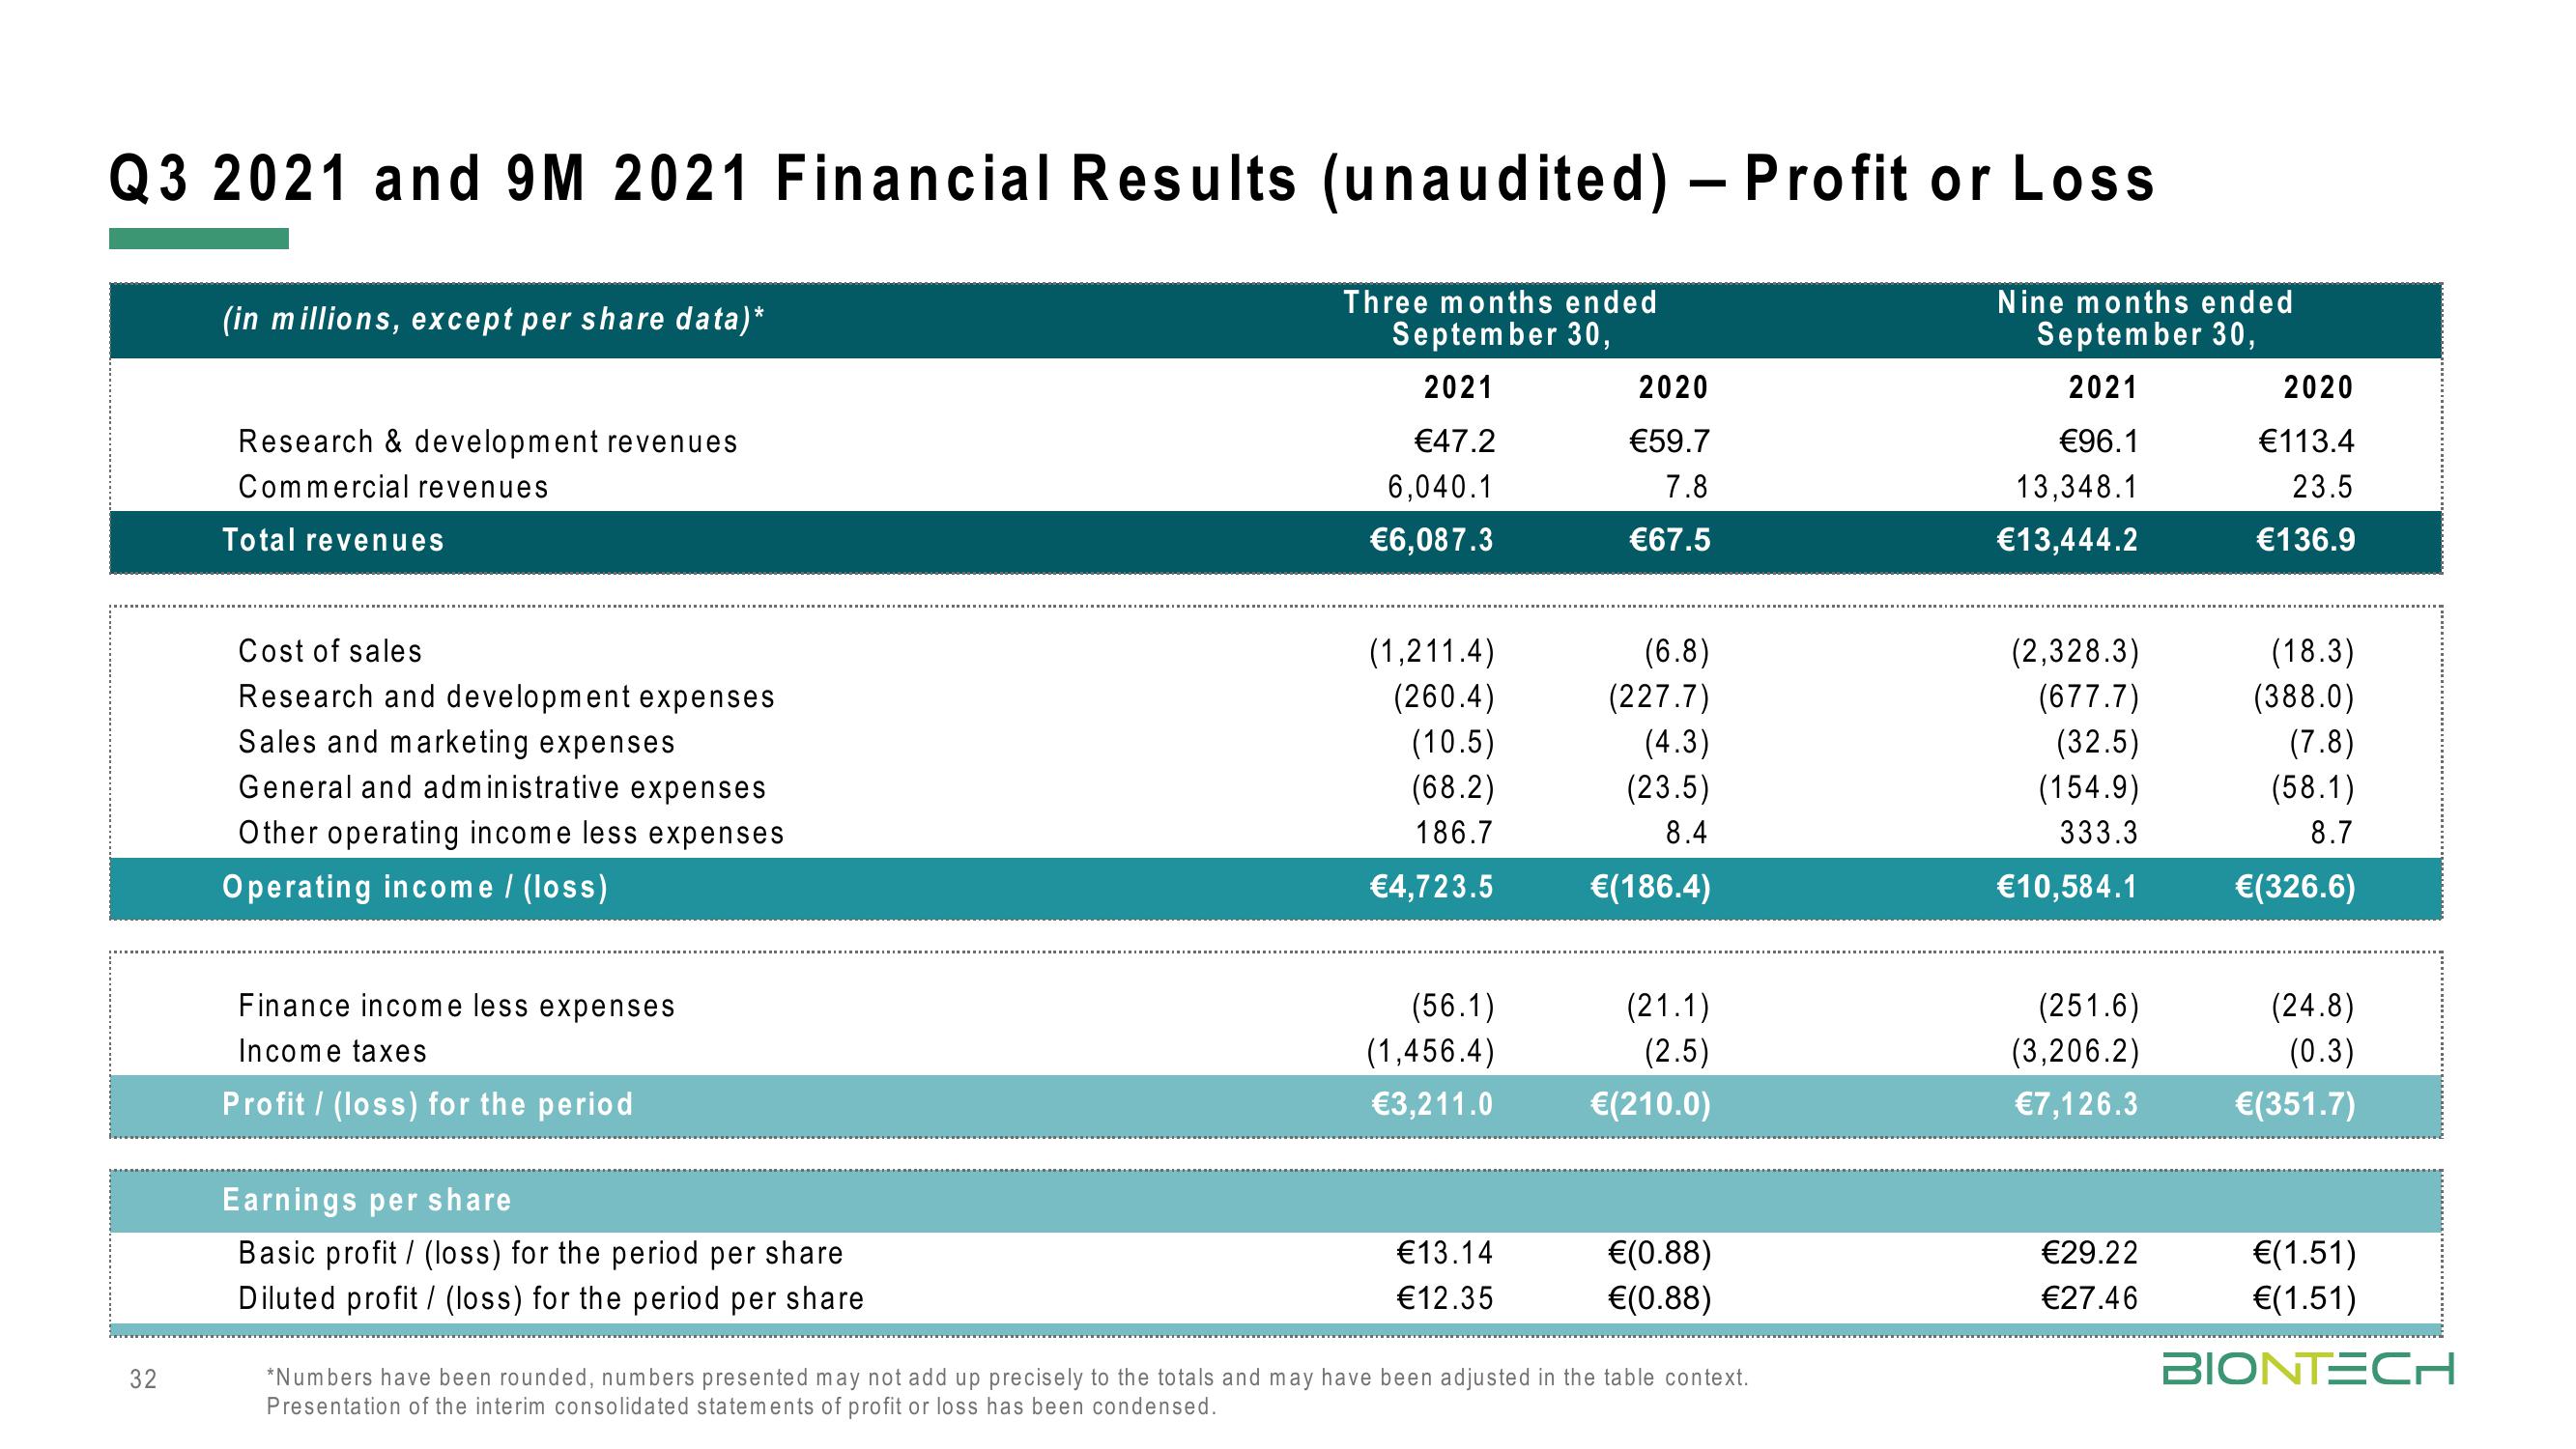
Q3 2021 and 9M 2021 Financial Results (unaudited) - Profit or Loss
Three months ended
September 30,
2021
32
(in millions, except per share data)*
Research & development revenues
Commercial revenues
Total revenues
Cost of sales
Research and development expenses
Sales and marketing expenses
General and administrative expenses
Other operating income less expenses
Operating income / (loss)
Finance income less expenses
Income taxes
Profit (loss) for the period
Earnings per share
Basic profit/ (loss) for the period per share
Diluted profit/ (loss) for the period per share
€47.2
6,040.1
€6,087.3
(1,211.4)
(260.4)
(10.5)
(68.2)
186.7
€4,723.5
(56.1)
(1,456.4)
€3,211.0
€13.14
€12.35
2020
€59.7
7.8
€67.5
(6.8)
(227.7)
(4.3)
(23.5)
8.4
€(186.4)
(21.1)
(2.5)
€(210.0)
€(0.88)
€(0.88)
*Numbers have been rounded, numbers presented may not add up precisely to the totals and may have been adjusted in the table context.
Presentation of the interim consolidated statements of profit or loss has been condensed.
Nine months ended
September 30,
2021
€96.1
13,348.1
€13,444.2
(2,328.3)
(677.7)
(32.5)
(154.9)
333.3
€10,584.1
(251.6)
(3,206.2)
€7,126.3
€29.22
€27.46
2020
€113.4
23.5
€136.9
(18.3)
(388.0)
(7.8)
(58.1)
8.7
€(326.6)
(24.8)
(0.3)
€(351.7)
€(1.51)
€(1.51)
BIONTECHView entire presentation