Bed Bath & Beyond Results Presentation Deck
FINANCIAL OUTLOOK
Revising Full Year Fiscal 2021 Outlook
P&L
BED BATH & BEYOND
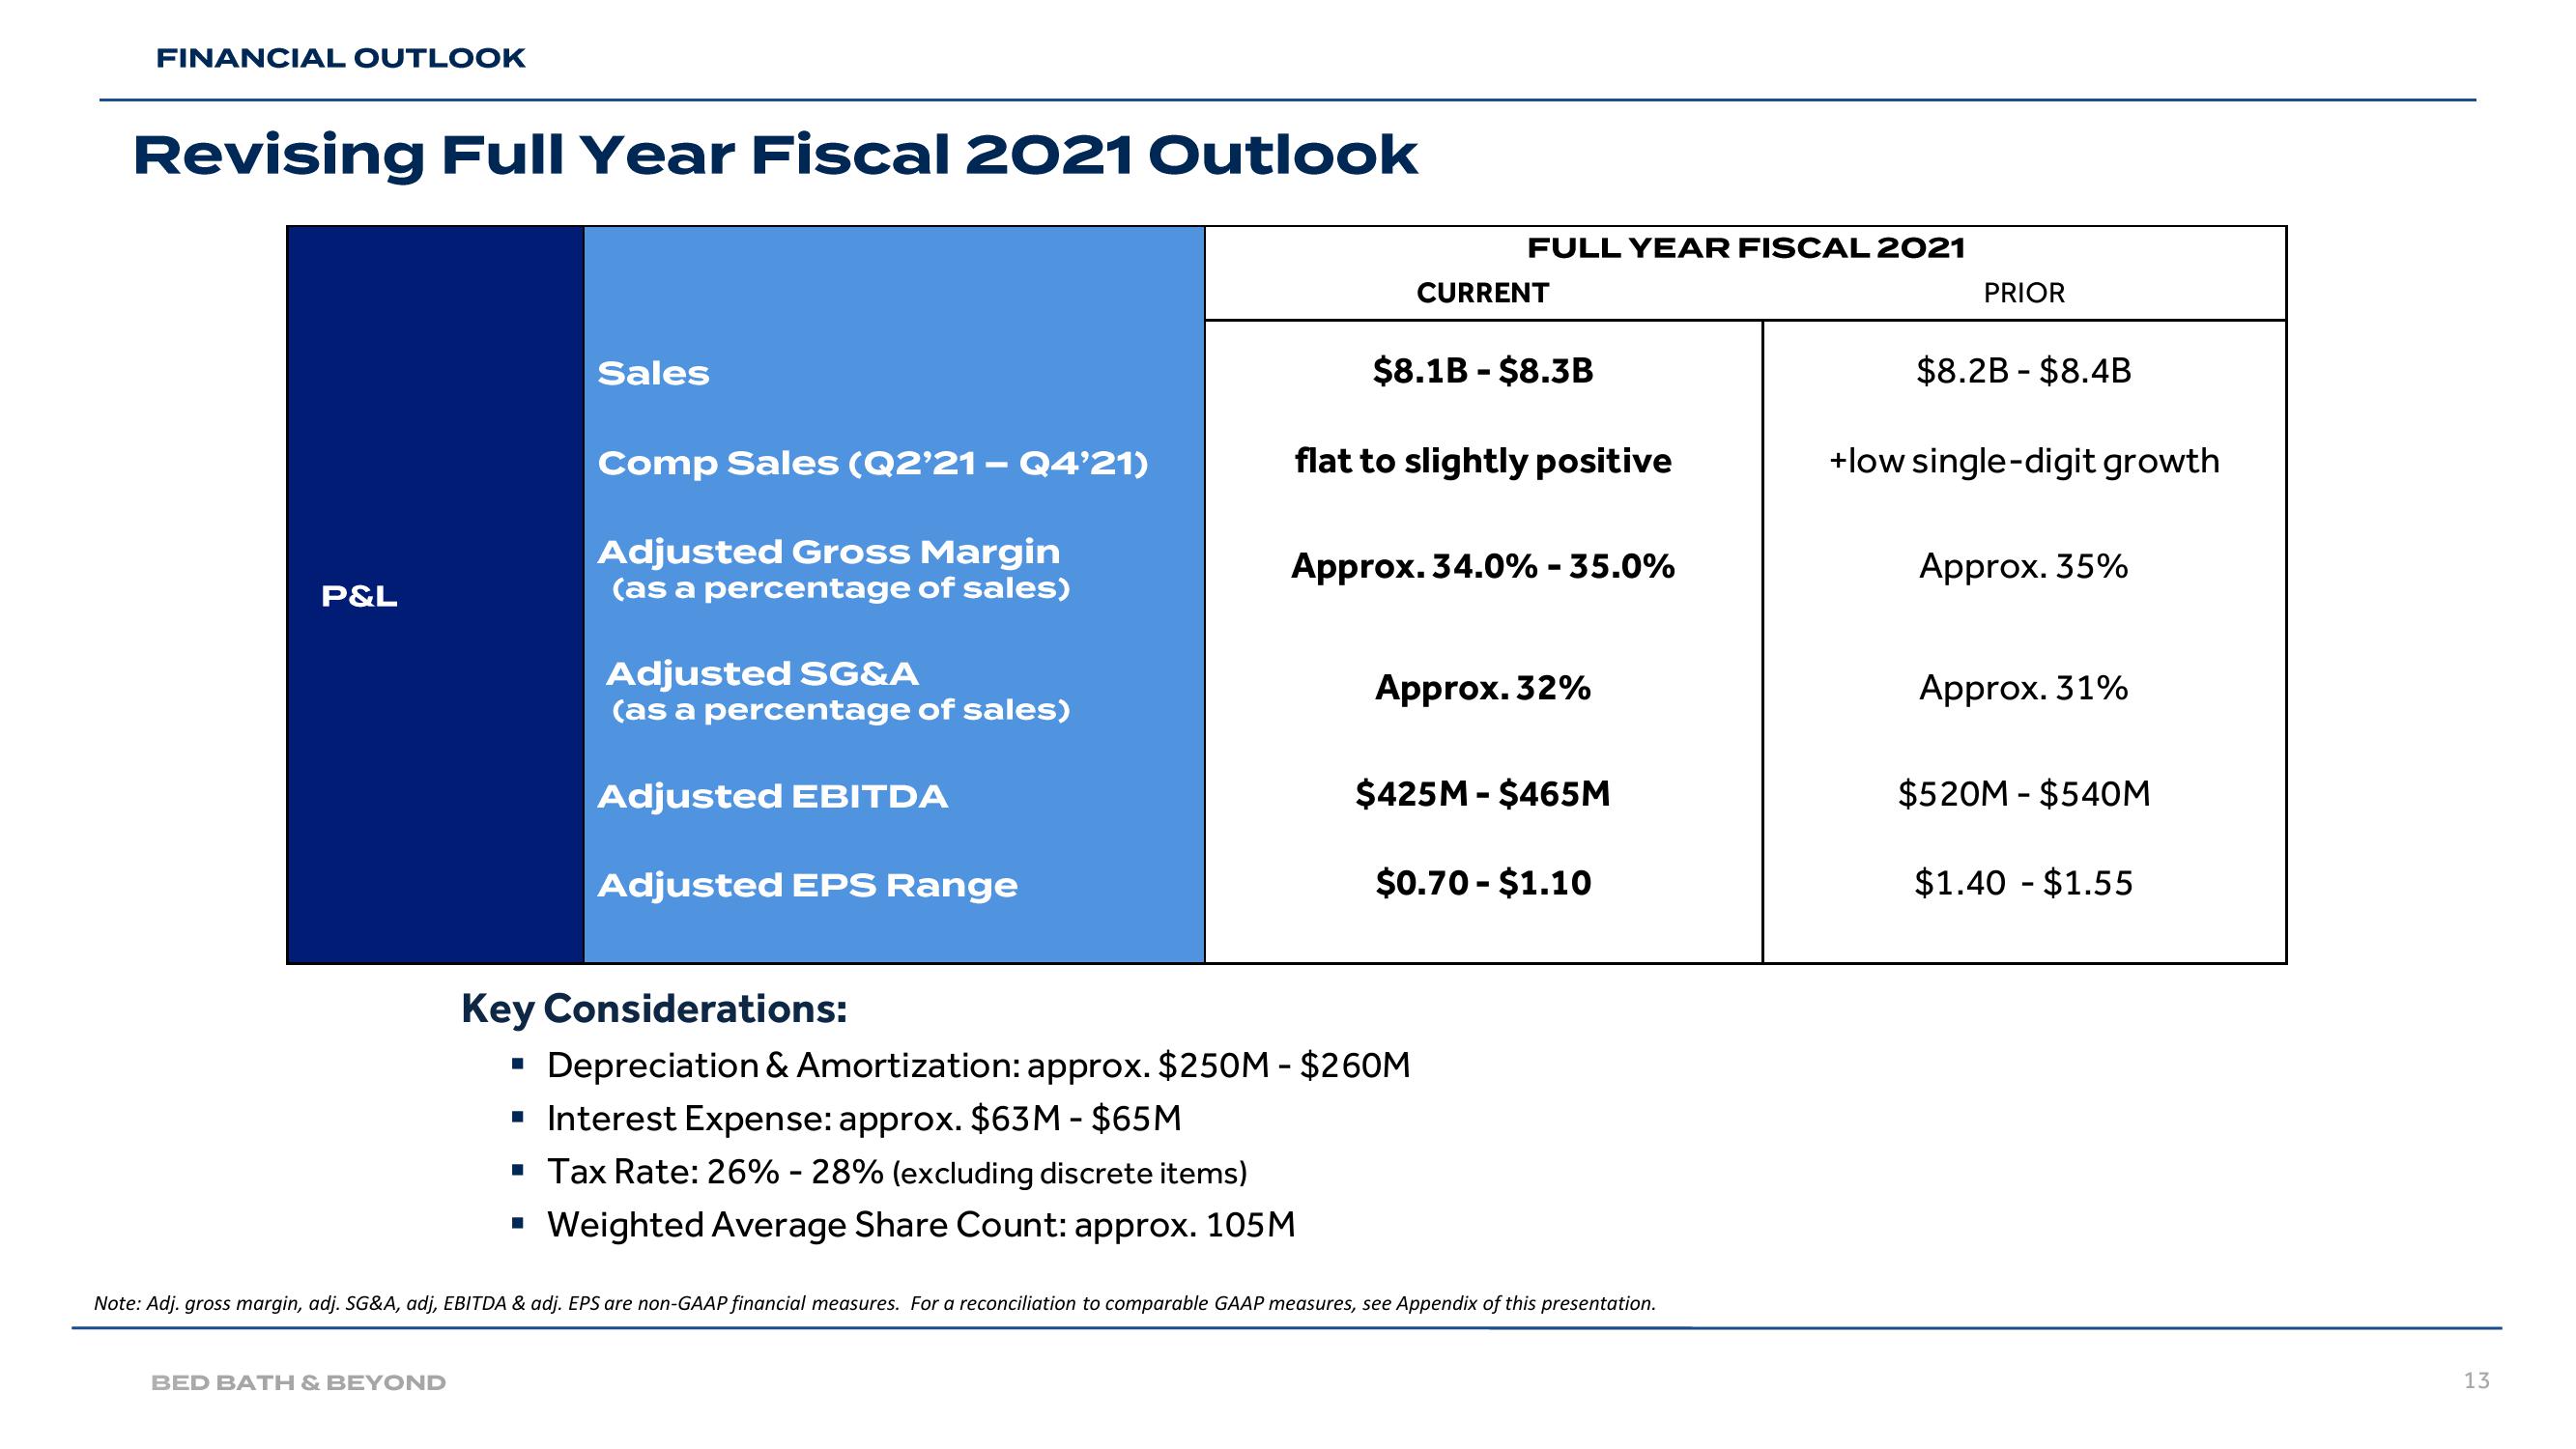
Sales
Comp Sales (Q2'21 – Q4'21)
Adjusted Gross Margin
(as a percentage of sales)
■
Adjusted SG&A
(as a percentage of sales)
Adjusted EBITDA
Adjusted EPS Range
Key Considerations:
FULL YEAR FISCAL 2021
CURRENT
$8.1B - $8.3B
flat to slightly positive
Approx. 34.0% - 35.0%
Approx. 32%
Depreciation & Amortization: approx. $250M - $260M
▪ Interest Expense: approx. $63M - $65M
▪ Tax Rate: 26% -28% (excluding discrete items)
Weighted Average Share Count: approx. 105M
$425M-$465M
$0.70-$1.10
Note: Adj. gross margin, adj. SG&A, adj, EBITDA & adj. EPS are non-GAAP financial measures. For a reconciliation to comparable GAAP measures, see Appendix of this presentation.
PRIOR
$8.2B - $8.4B
+low single-digit growth
Approx. 35%
Approx. 31%
$520M - $540M
$1.40 - $1.55
13View entire presentation