Apollo Global Management Investor Day Presentation Deck
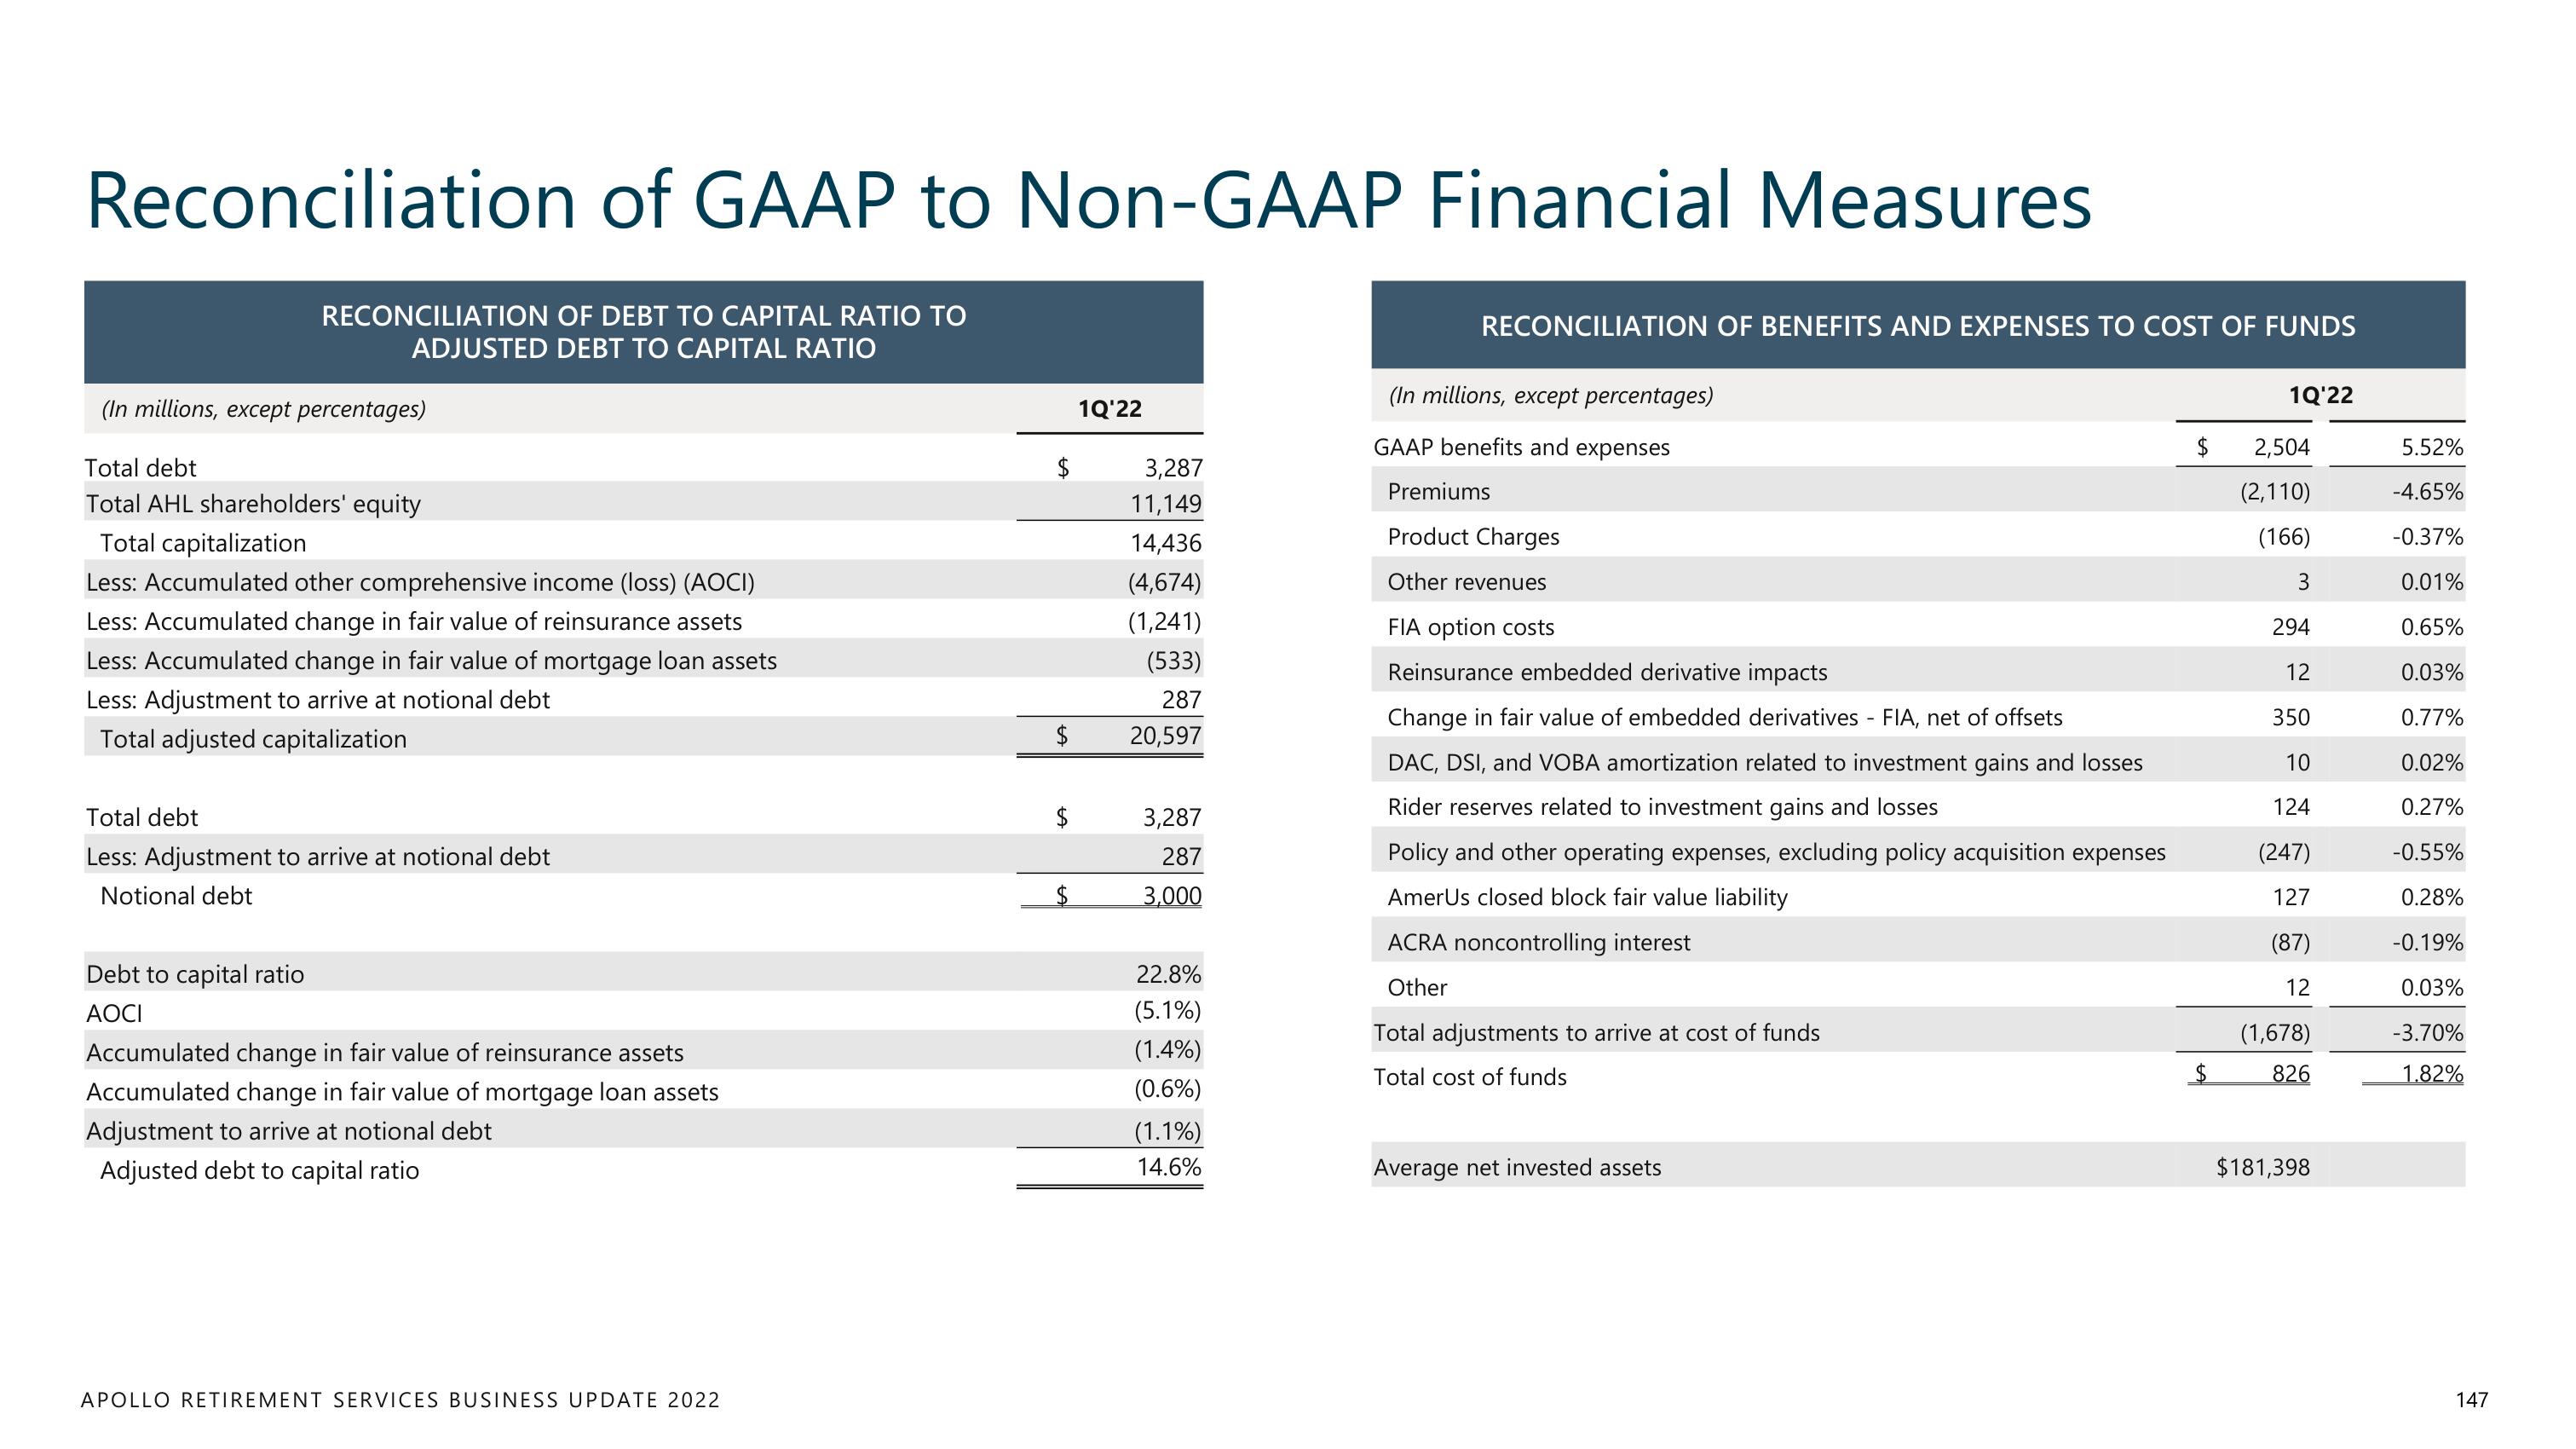
Reconciliation of GAAP to Non-GAAP Financial Measures
RECONCILIATION OF DEBT TO CAPITAL RATIO TO
ADJUSTED DEBT TO CAPITAL RATIO
(In millions, except percentages)
Total debt
Total AHL shareholders' equity
Total capitalization
Less: Accumulated other comprehensive income (loss) (AOCI)
Less: Accumulated change in fair value of reinsurance assets
Less: Accumulated change in fair value of mortgage loan assets
Less: Adjustment to arrive at notional debt
Total adjusted capitalization
Total debt
Less: Adjustment to arrive at notional debt
Notional debt
Debt to capital ratio
AOCI
Accumulated change in fair value of reinsurance assets
Accumulated change in fair value of mortgage loan assets
Adjustment to arrive at notional debt
Adjusted debt to capital ratio
APOLLO RETIREMENT SERVICES BUSINESS UPDATE 2022
1Q'22
$
3,287
11,149
14,436
(4,674)
(1,241)
(533)
287
$ 20,597
3,287
287
3,000
22.8%
(5.1%)
(1.4%)
(0.6%)
(1.1%)
14.6%
RECONCILIATION OF BENEFITS AND EXPENSES TO COST OF FUNDS
(In millions, except percentages)
GAAP benefits and expenses
Premiums
Product Charges
Other revenues
FIA option costs
Reinsurance embedded derivative impacts
Change in fair value of embedded derivatives - FIA, net of offsets
DAC, DSI, and VOBA amortization related to investment gains and losses
Rider reserves related to investment gains and losses
Policy and other operating expenses, excluding policy acquisition expenses
AmerUs closed block fair value liability
ACRA noncontrolling interest
Other
Total adjustments to arrive at cost of funds
Total cost of funds
Average net invested assets
$
$
1Q'22
2,504
(2,110)
(166)
3
294
12
350
10
124
(247)
127
(87)
12
(1,678)
826
$181,398
5.52%
-4.65%
-0.37%
0.01%
0.65%
0.03%
0.77%
0.02%
0.27%
-0.55%
0.28%
-0.19%
0.03%
-3.70%
1.82%
147View entire presentation