OpenText Investor Presentation Deck slide image

OpenText Investor Presentation Deck

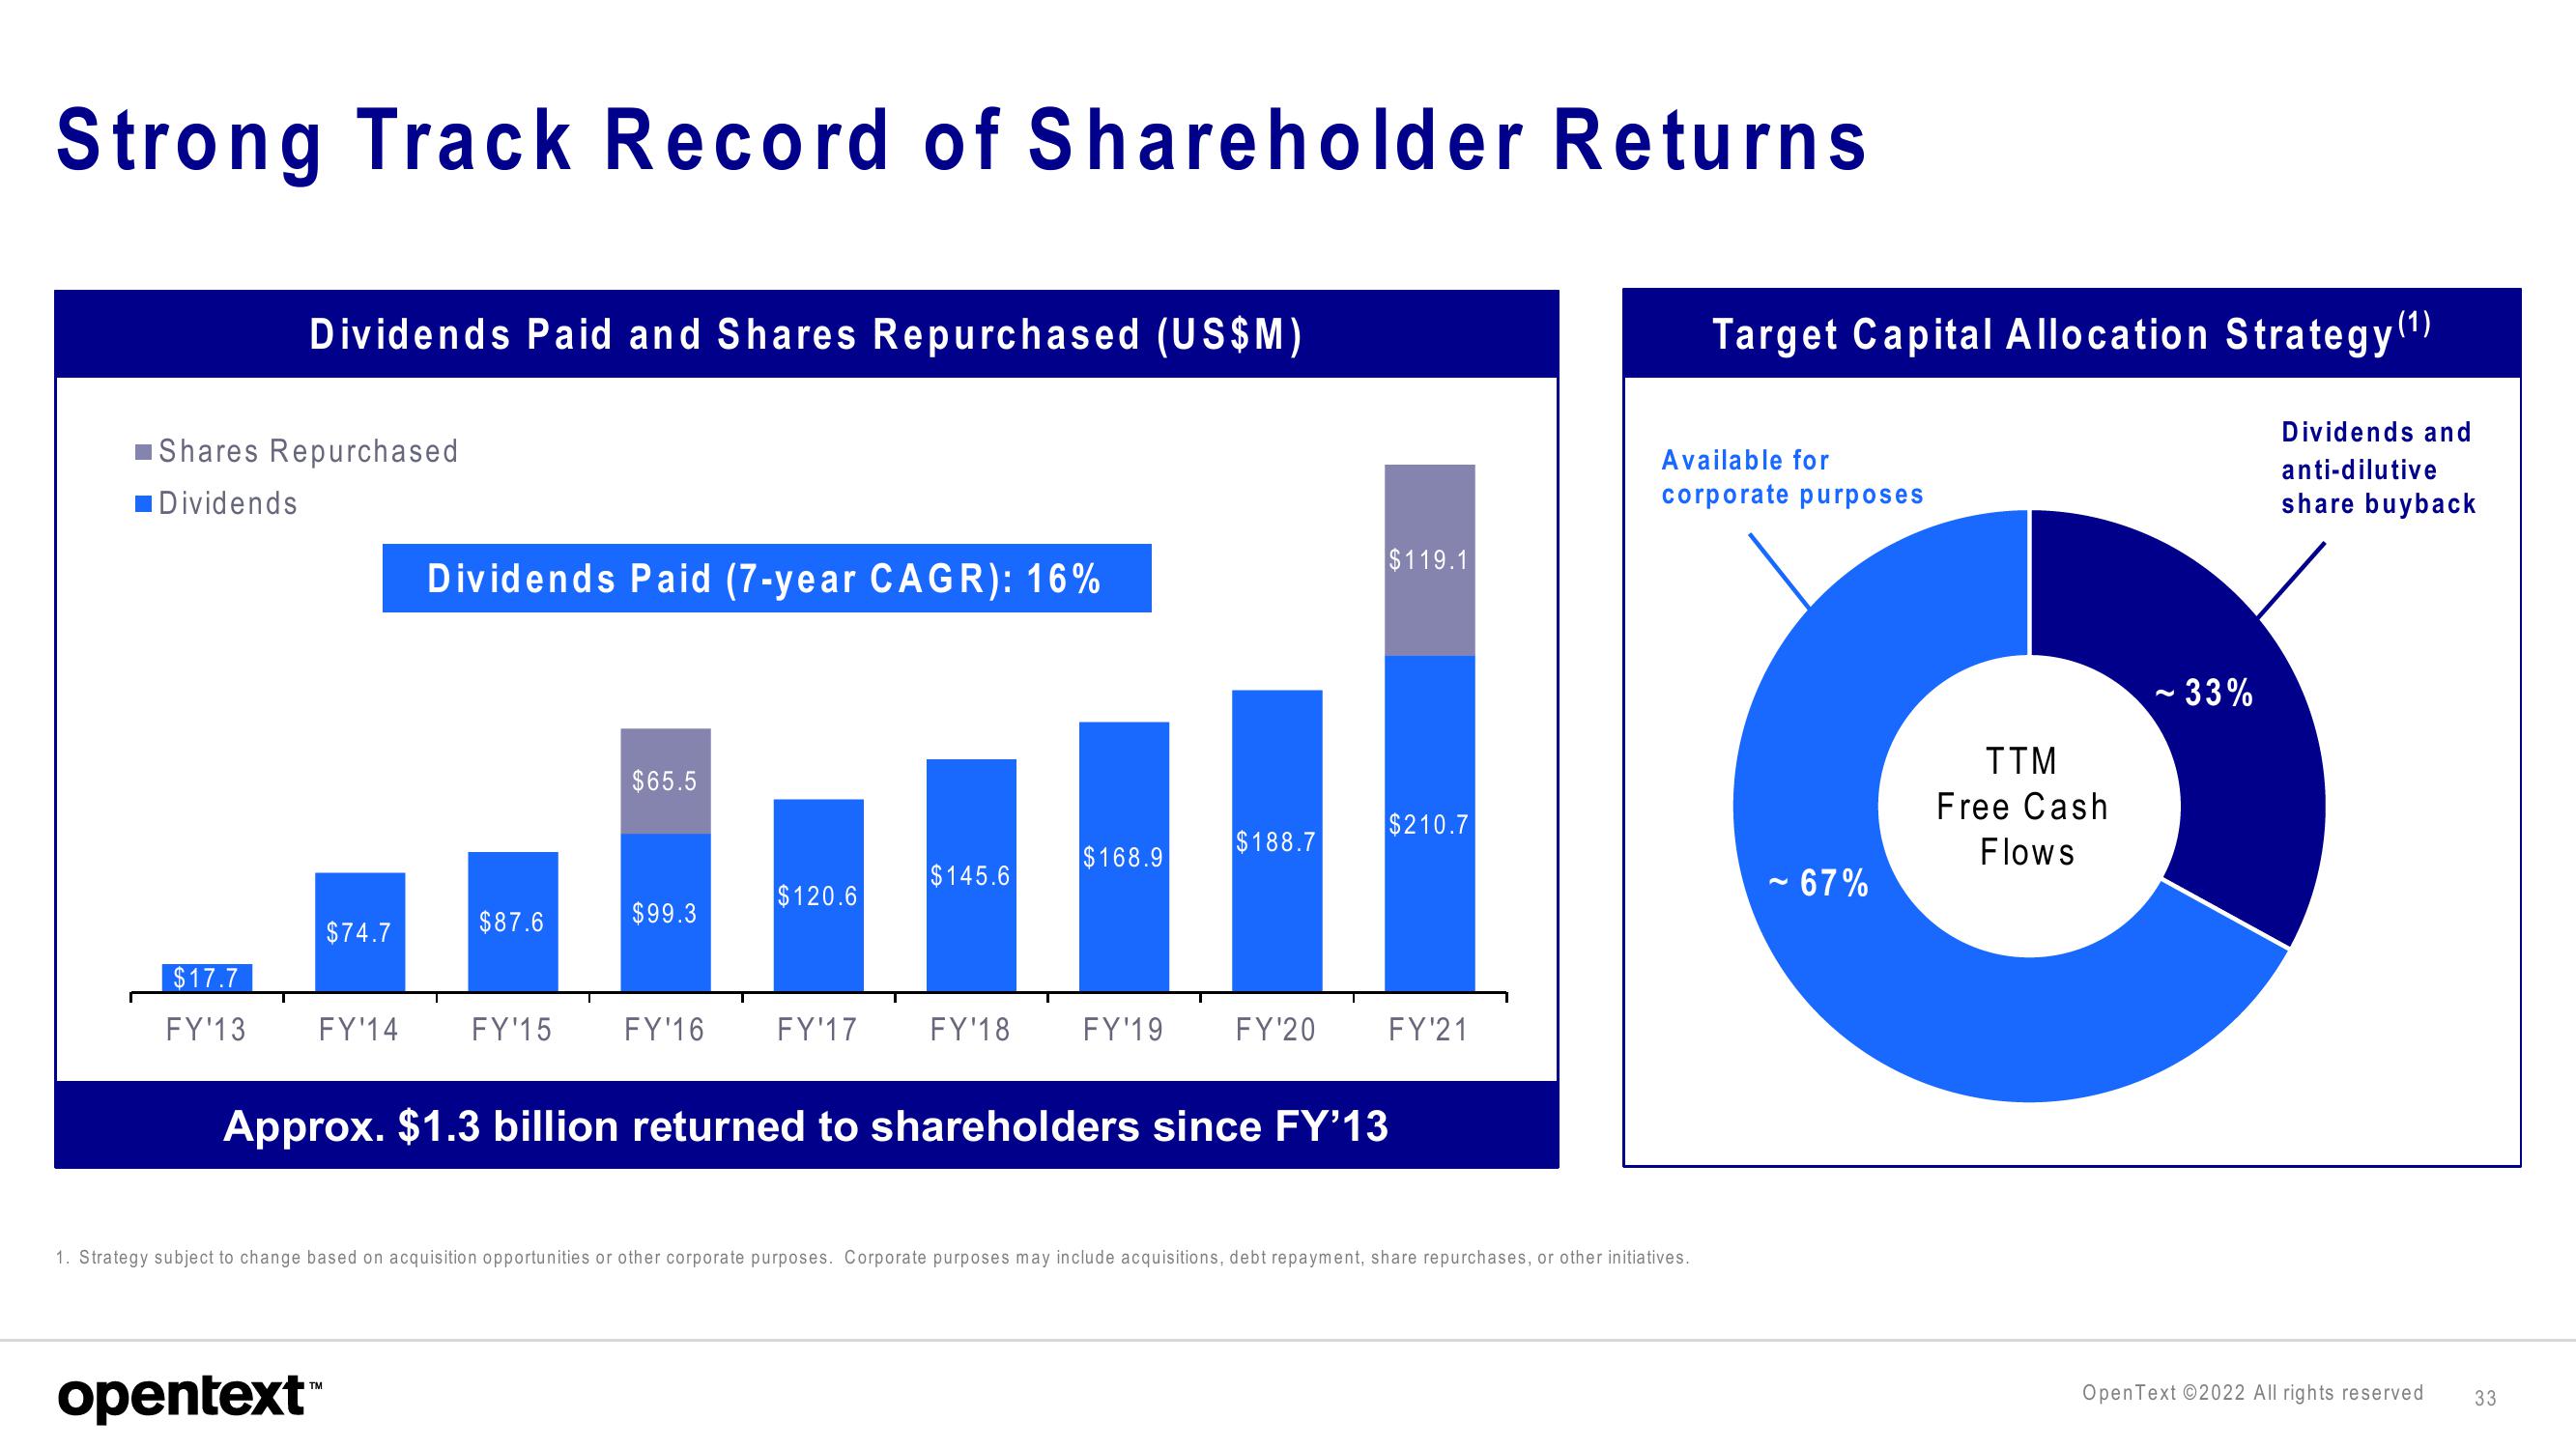
Strong Track Record of Shareholder Returns Dividends Paid and Shares Repurchased (US$M) Shares Repurchased ■Dividends $17.7 FY'13 $74.7 FY'14 Dividends Paid (7-year CAGR): 16% opentext™ $87.6 FY'15 $65.5 $99.3 FY'16 $120.6 FY'17 $145.6 FY'18 $168.9 FY'19 $188.7 FY'20 $119.1 $210.7 FY'21 Approx. $1.3 billion returned to shareholders since FY'13 1. Strategy subject to change based on acquisition opportunities or other corporate purposes. Corporate purposes may include acquisitions, debt repayment, share repurchases, or other initiatives. Target Capital Allocation Strategy (¹) Dividends and anti-dilutive share buyback Available for corporate purposes ~ 67% TTM Free Cash Flows ~ 33% OpenText ©2022 All rights reserved 33
View entire presentation