DraftKings Investor Day Presentation Deck
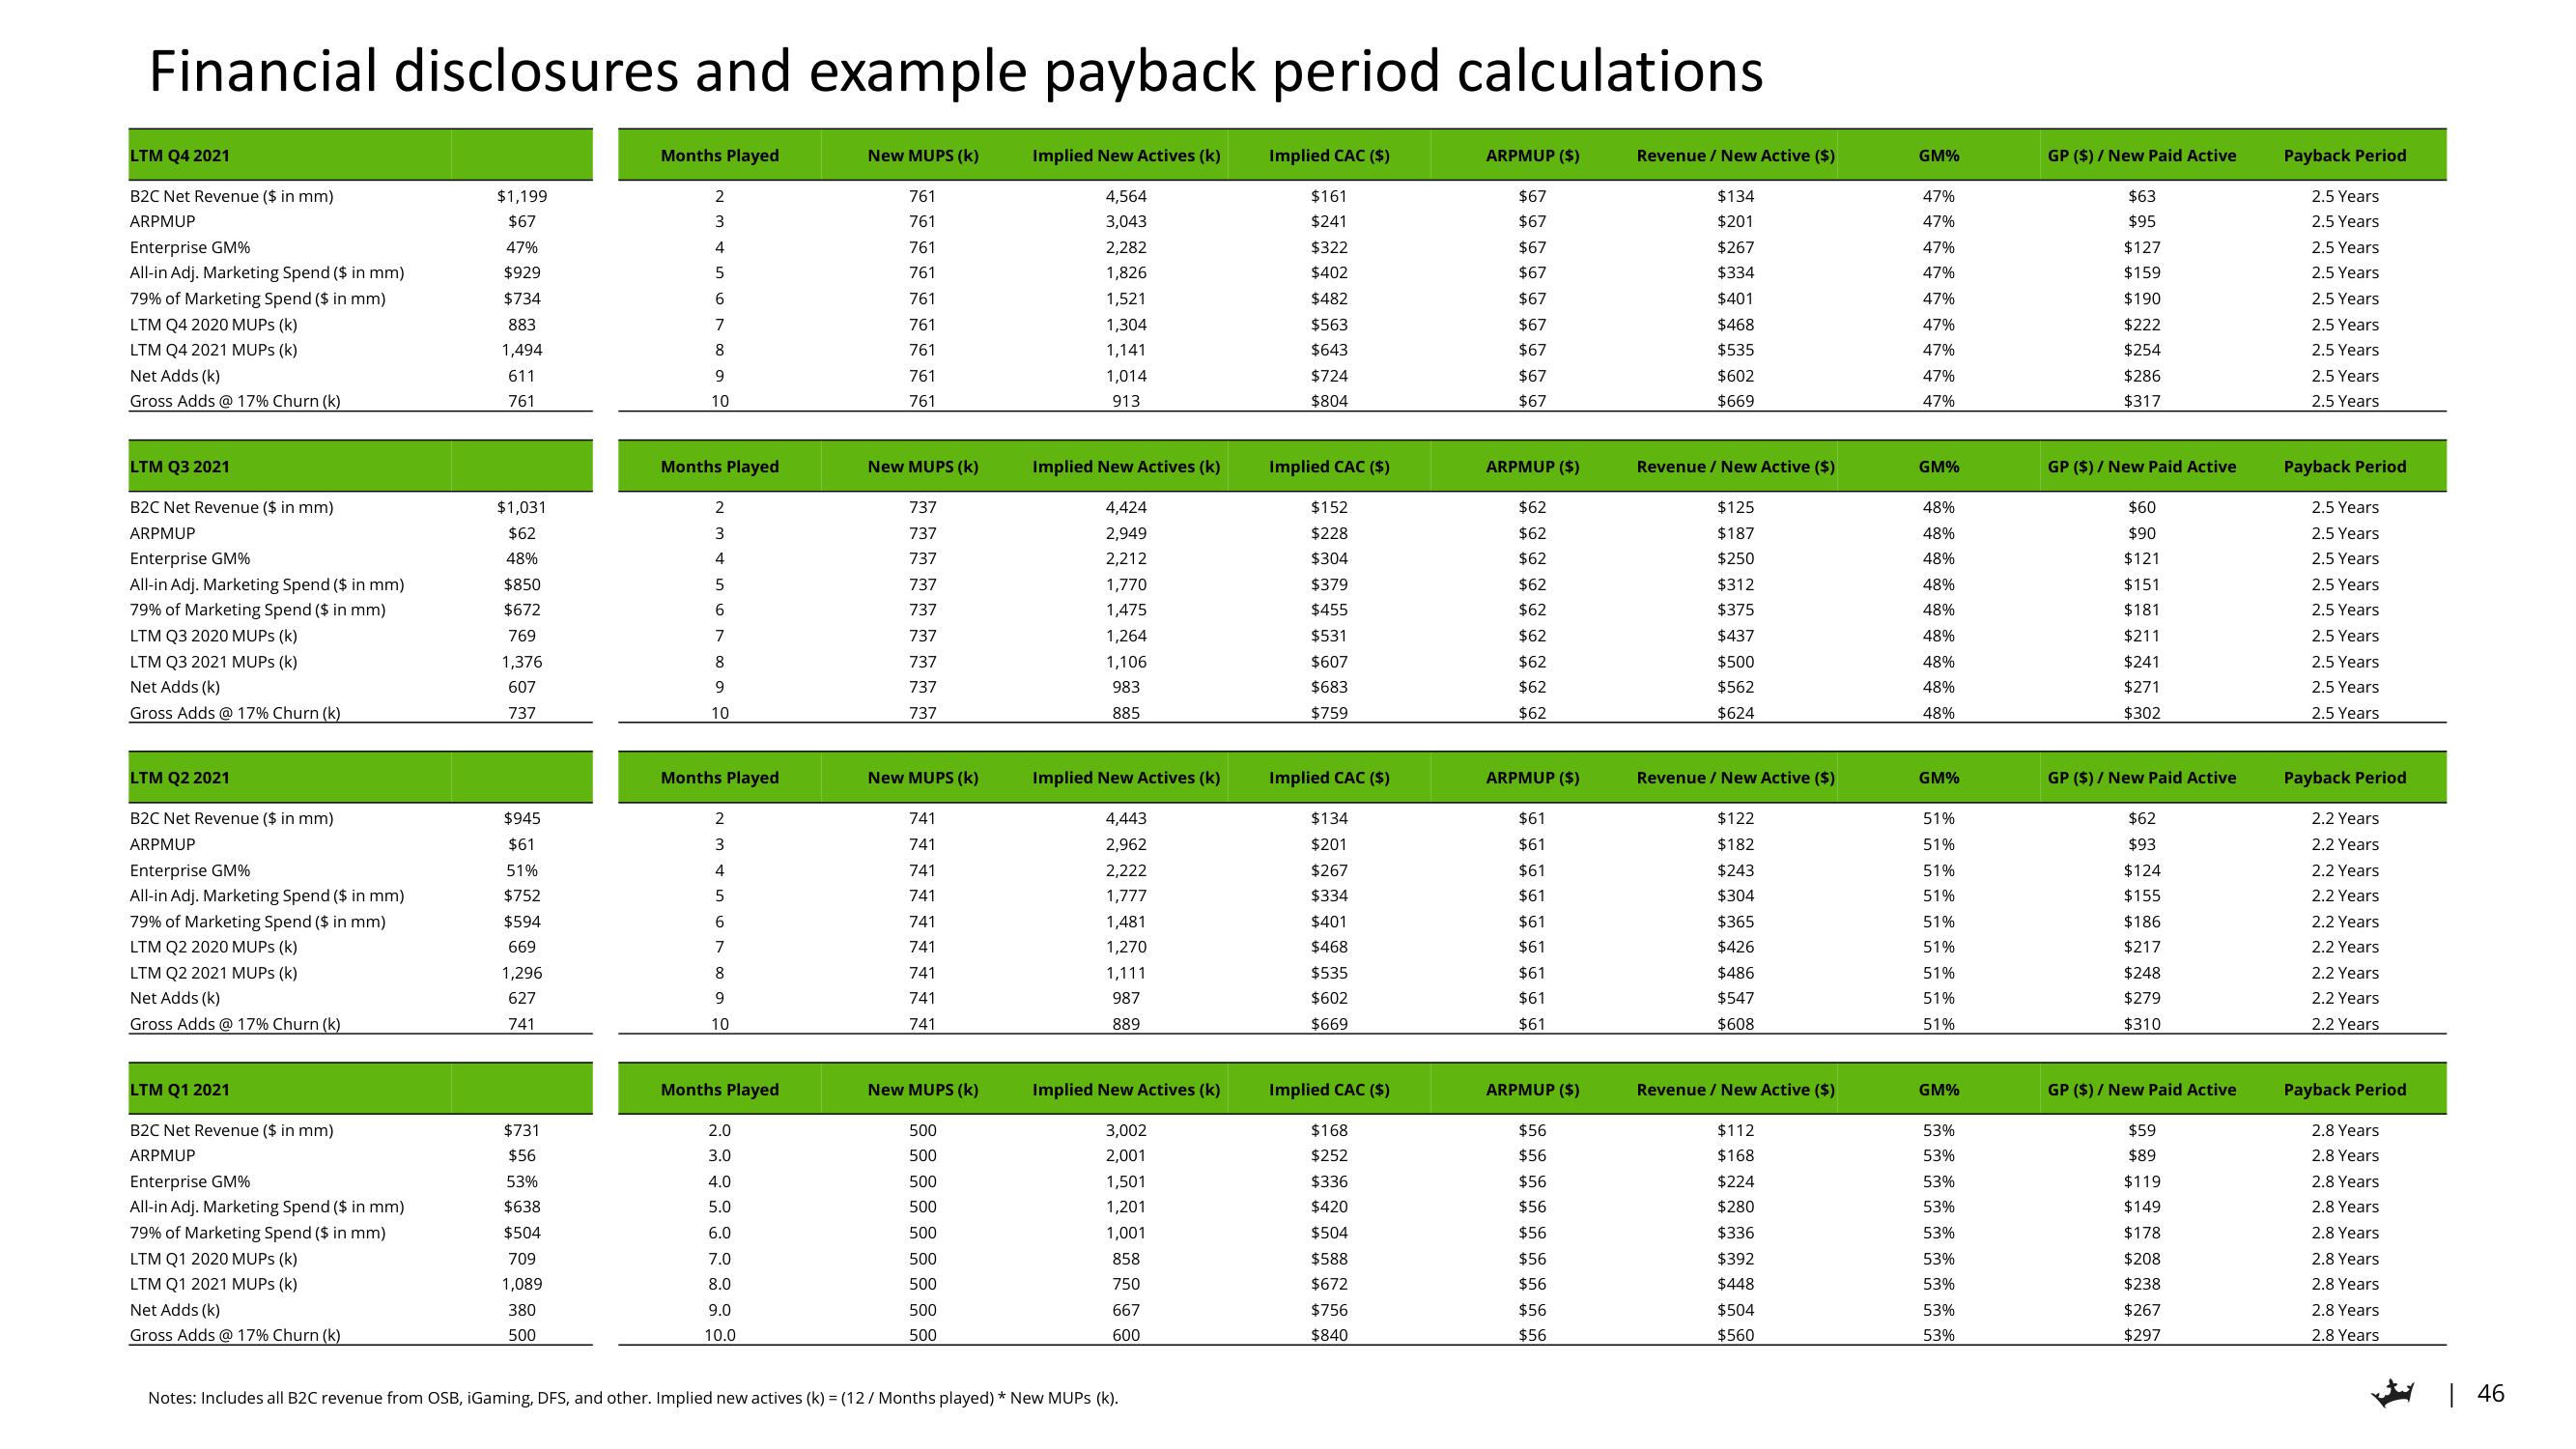
Financial disclosures and example payback period calculations
LTM Q4 2021
B2C Net Revenue ($ in mm)
ARPMUP
Enterprise GM%
All-in Adj. Marketing Spend ($ in mm)
79% of Marketing Spend ($ in mm)
LTM Q4 2020 MUPS (k)
LTM Q4 2021 MUPS (k)
Net Adds (k)
Gross Adds @ 17% Churn (k)
LTM Q3 2021
B2C Net Revenue ($ in mm)
ARPMUP
Enterprise GM%
All-in Adj. Marketing Spend ($ in mm)
79% of Marketing Spend ($ in mm)
LTM Q3 2020 MUPS (k)
LTM Q3 2021 MUPS (k)
Net Adds (k)
Gross Adds @ 17% Churn (k)
LTM Q2 2021
B2C Net Revenue ($ in mm)
ARPMUP
Enterprise GM%
All-in Adj. Marketing Spend ($ in mm)
79% of Marketing Spend ($ in mm)
LTM Q2 2020 MUPS (k)
LTM Q2 2021 MUPS (k)
Net Adds (k)
Gross Adds @ 17% Churn (k)
LTM Q1 2021
B2C Net Revenue ($ in mm)
ARPMUP
Enterprise GM%
All-in Adj. Marketing Spend ($ in mm)
79% of Marketing Spend ($ in mm)
LTM Q1 2020 MUPS (K)
LTM Q1 2021 MUPs (k)
Net Adds (k)
Gross Adds @ 17% Churn (k)
$1,199
$67
47%
$929
$734
883
1,494
611
761
$1,031
$62
48%
$850
$672
769
1,376
607
737
$945
51%
$752
$594
669
1,296
627
741
$731
$56
53%
$638
$504
709
1,089
380
500
Months Played
2
3
4
5
6
7
8
9
10
Months Played
2
3
4
5
6
7
8
9
10
Months Played
2
4
5
6
7
8
9
10
Months Played
2.0
3.0
4.0
5.0
6.0
7.0
8.0
9.0
10.0
New MUPS (k)
761
761
761
761
761
761
761
761
761
New MUPS (k)
737
737
737
737
737
737
737
737
737
New MUPS (k)
741
741
741
741
741
741
741
741
741
New MUPS (k)
500
500
500
500
500
500
500
500
500
Implied New Actives (k)
4,564
3,043
2,282
1,826
1,521
1,304
1,141
1,014
913
Implied New Actives (k)
4,424
2,949
2,212
1,770
1,475
1,264
1,106
983
885
Implied New Actives (k)
4,443
2,222
1,777
1,481
1,270
1,111
987
889
Implied New Actives (k)
3,002
2,001
1,501
1,201
1,001
858
750
667
600
Notes: Includes all B2C revenue from OSB, iGaming, DFS, and other. Implied new actives (k) = (12/ Months played) * New MUPS (k).
Implied CAC ($)
$161
$241
$322
$402
$482
$563
$643
$724
$804
Implied CAC ($)
$152
$228
$304
$379
$455
$531
$607
$683
$759
Implied CAC ($)
$134
$201
$267
$334
$401
$468
$535
$602
$669
Implied CAC ($)
$168
$252
$336
$420
$504
$588
$672
$756
$840
ARPMUP ($)
$67
$67
$67
$67
$67
$67
$67
$67
$67
ARPMUP ($)
$62
$62
$62
$62
$62
$62
$62
$62
$62
ARPMUP ($)
$61
$61
$61
$61
$61
$61
$61
$61
$61
ARPMUP ($)
$56
$56
$56
$56
$56
$56
$56
$56
$56
Revenue / New Active ($)
$134
$201
$267
$334
$401
$468
$535
$602
$669
Revenue / New Active ($)
$125
$187
$250
$312
$375
$437
$500
$562
$624
Revenue / New Active ($)
$122
$182
$243
$304
$365
$426
$486
$547
$608
Revenue / New Active ($)
$112
$168
$224
$280
$336
$392
$448
$504
$560
GM%
47%
47%
47%
47%
47%
47%
47%
47%
47%
GM%
48%
48%
48%
48%
48%
48%
48%
48%
48%
GM%
51%
51%
51%
51%
51%
51%
51%
51%
GM%
53%
53%
53%
53%
53%
53%
53%
53%
53%
GP ($)/ New Paid Active
$63
$95
$127
$159
$190
$222
$254
$286
$317
GP ($)/ New Paid Active
$60
$90
$121
$151
$181
$211
$241
$271
$302
GP ($)/ New Paid Active
$62
$93
$124
$155
$186
$217
$248
$279
$310
GP ($)/ New Paid Active
$59
$89
$119
$149
$178
$208
$238
$267
$297
Payback Period
2.5 Years
2.5 Years
2.5 Years
2.5 Years
2.5 Years
2.5 Years
2.5 Years
2.5 Years
2.5 Years
Payback Period
2.5 Years
2.5 Years
2.5 Years
2.5 Years
2.5 Years
2.5 Years
2.5 Years
2.5 Years
2.5 Years
Payback Period
2.2 Years
Years
2.2 Years
2.2 Years
2.2 Years
2.2 Years
2.2 Years
2.2 Years
2.2 Years
Payback Period
2.8 Years
2.8 Years
2.8 Years
2.8 Years
2.8 Years
2.8 Years
2.8 Years
2.8 Years
2.8 Years
| 46View entire presentation