Sonos Results Presentation Deck
Fiscal 2023 Financial Summary
NET REVENUE
$1,261
2019
89
$1,326
ADJUSTED EBITDA
2019
2020
109
2020
$1,717 $1,752
2021
279
2021
2022
227
2022
$1,655
CC: -3%
Reported: -6%
2023
154
2023
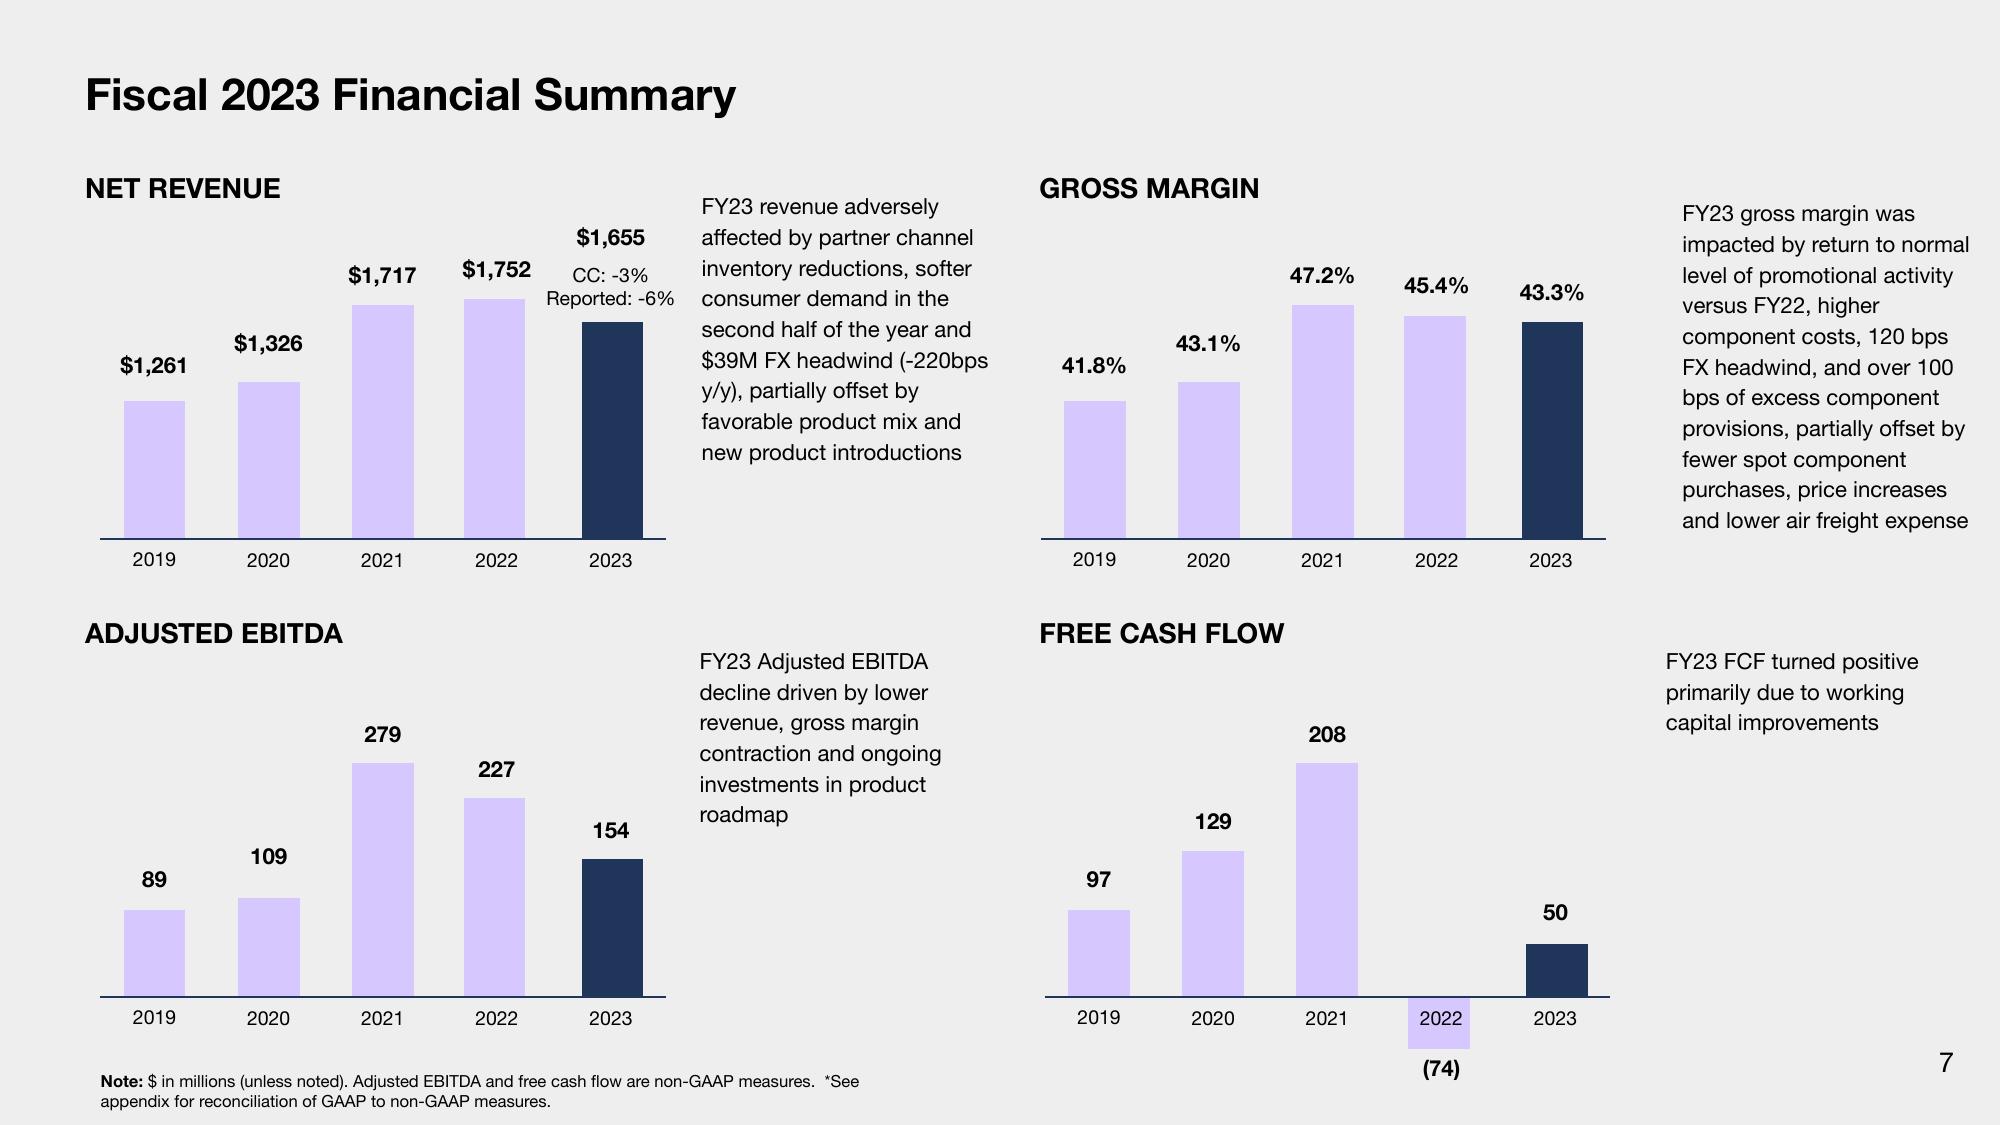
FY23 revenue adversely
affected by partner channel
inventory reductions, softer
consumer demand in the
second half of the year and
$39M FX headwind (-220bps
y/y), partially offset by
favorable product mix and
new product introductions
FY23 Adjusted EBITDA
decline driven by lower
revenue, gross margin
contraction and ongoing
investments in product
roadmap
Note: $ in millions (unless noted). Adjusted EBITDA and free cash flow are non-GAAP measures. "See
appendix for reconciliation of GAAP to non-GAAP measures.
GROSS MARGIN
41.8%
2019
97
43.1%
FREE CASH FLOW
2019
2020
129
2020
47.2%
2021
208
2021
45.4%
1
2022
2022
43.3%
(74)
2023
50
2023
FY23 gross margin was
impacted by return to normal
level of promotional activity
versus FY22, higher
component costs, 120 bps
FX headwind, and over 100
bps of excess component
provisions, partially offset by
fewer spot component
purchases, price increases
and lower air freight expense
FY23 FCF turned positive
primarily due to working
capital improvements
7View entire presentation