Paysafe Results Presentation Deck
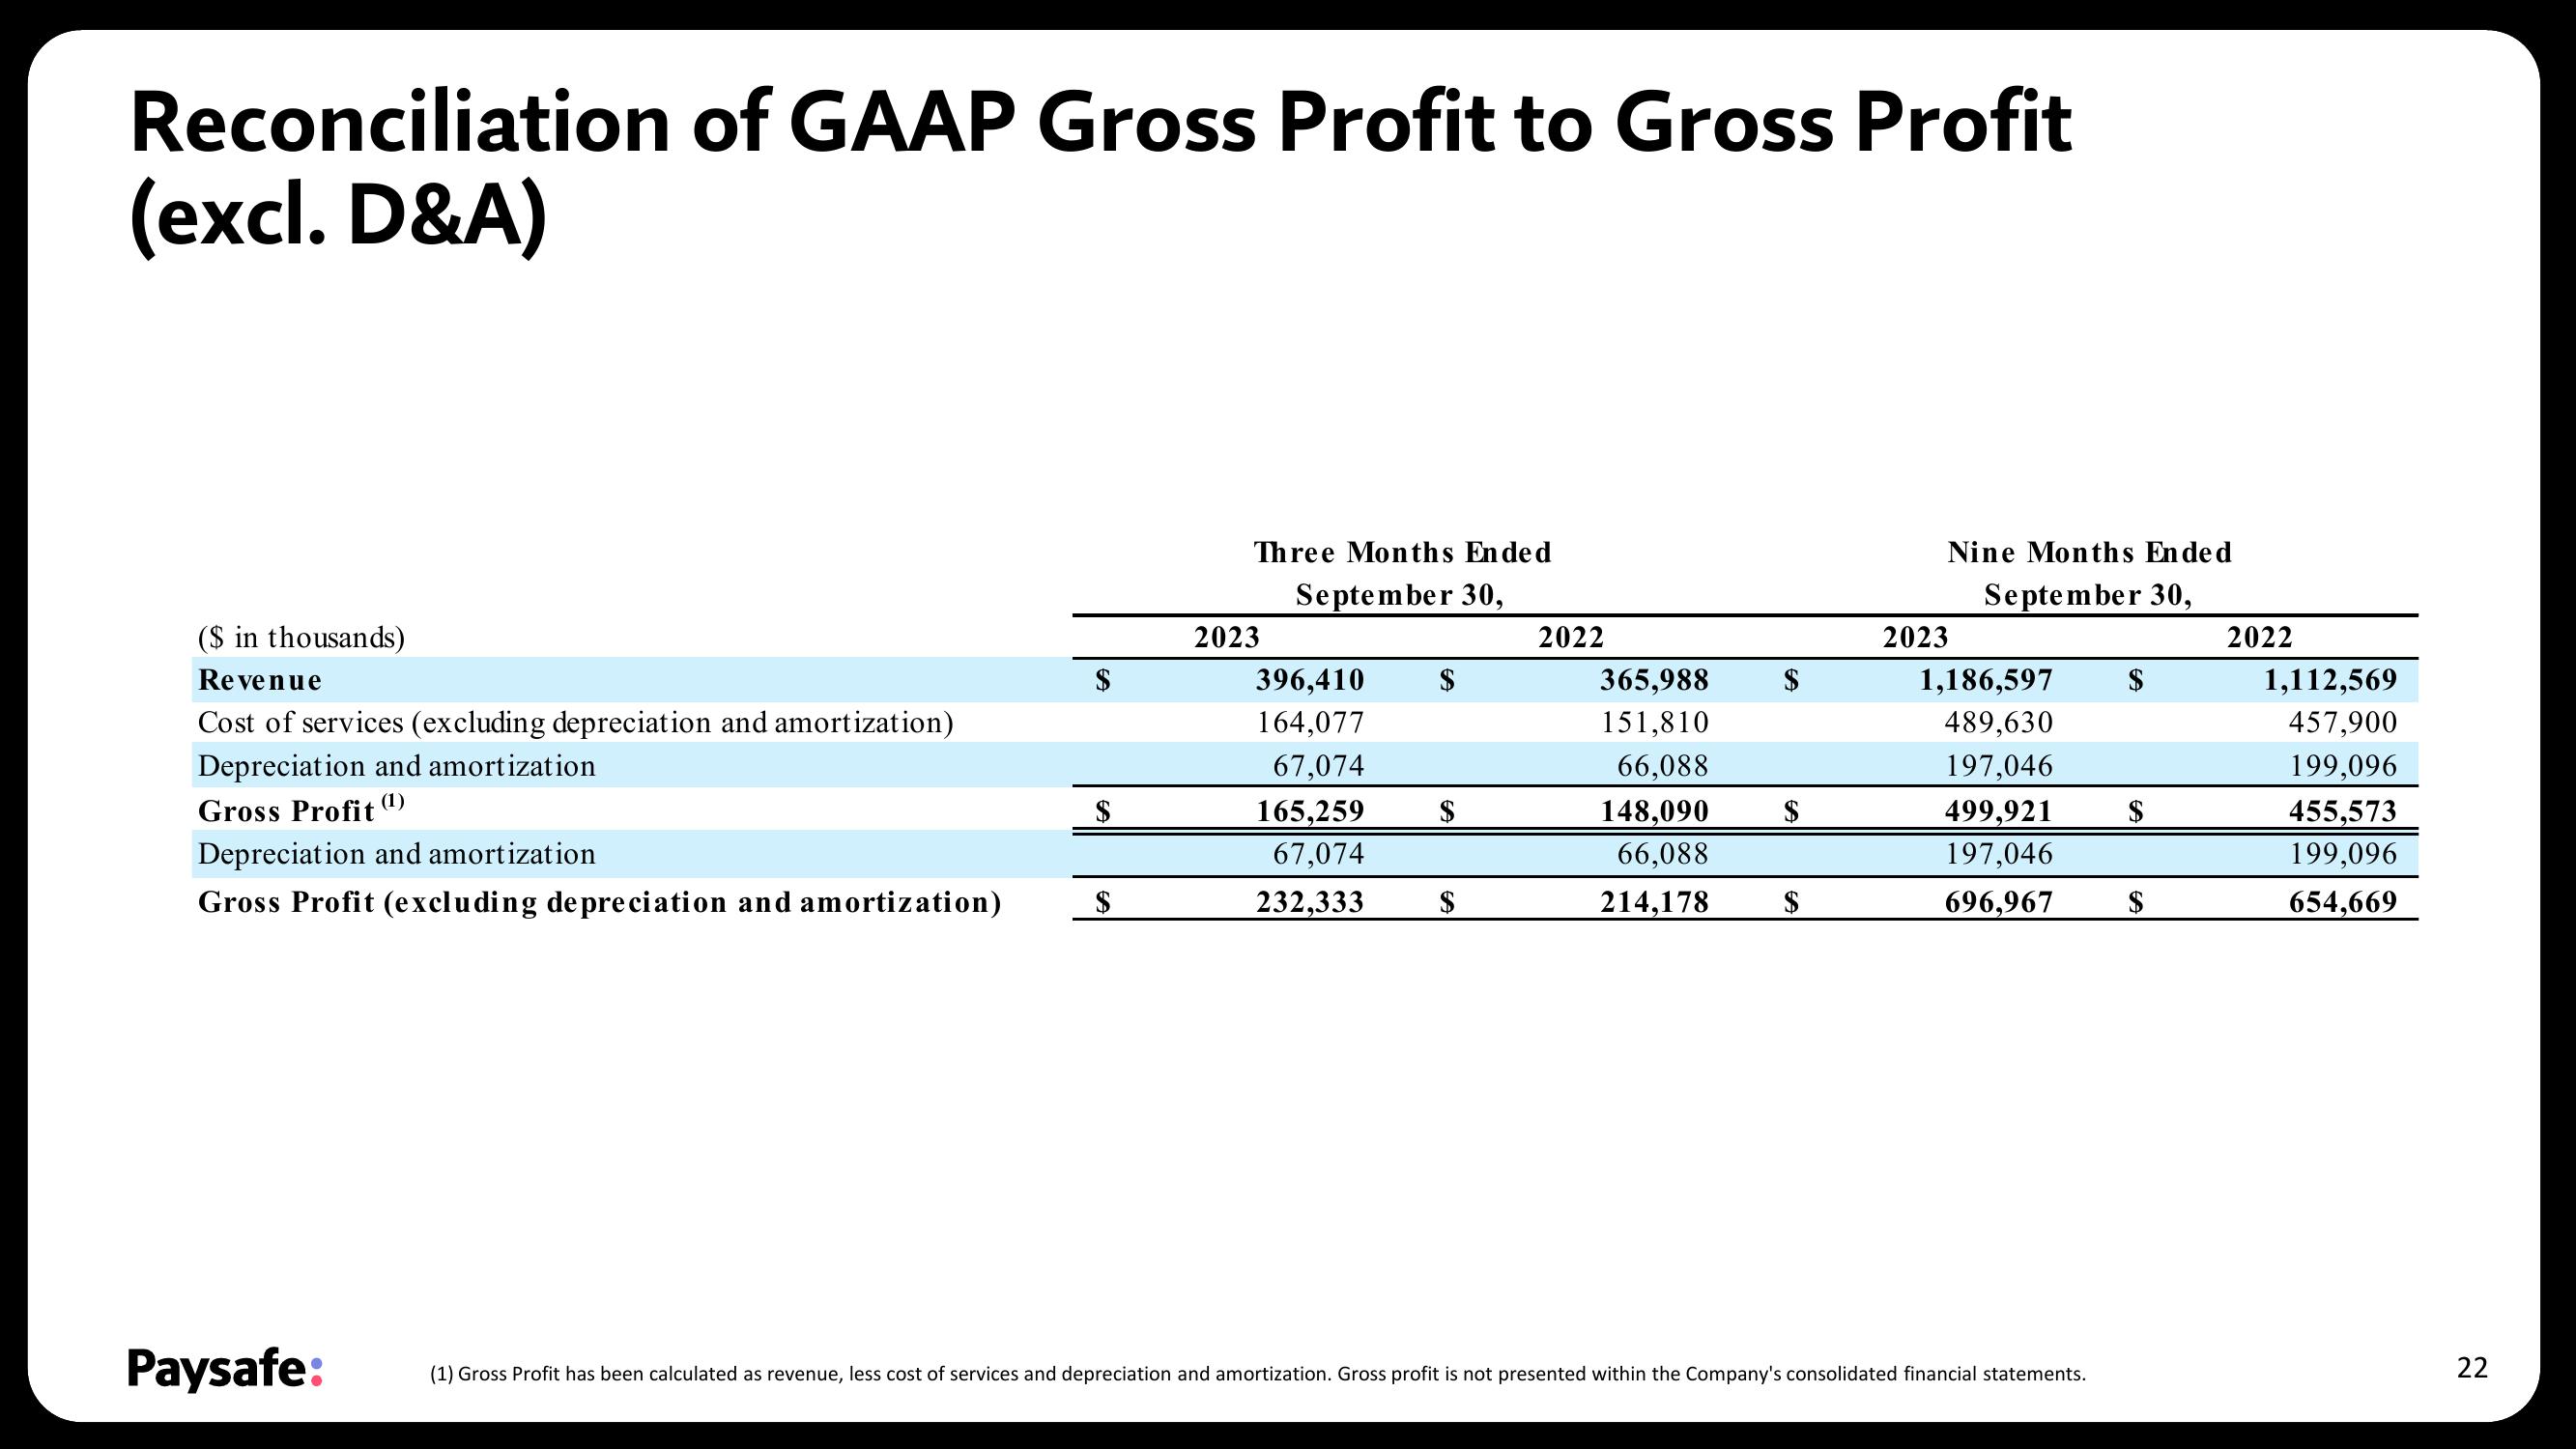
Reconciliation of GAAP Gross Profit to Gross Profit
(excl. D&A)
($ in thousands)
Revenue
Cost of services (excluding depreciation and amortization)
Depreciation and amortization
Gross Profit (¹1)
Depreciation and amortization
Gross Profit (excluding depreciation and amortization)
Paysafe:
$
Three Months Ended
September 30,
2023
396,410
164,077
67,074
165,259
67,074
232,333
$
2022
365,988
151,810
66,088
148,090
66,088
214,178
$
Nine Months Ended
September 30,
2023
1,186,597
489,630
197,046
499,921
197,046
696,967 $
(1) Gross Profit has been calculated as revenue, less cost of services and depreciation and amortization. Gross profit is not presented within the Company's consolidated financial statements.
2022
1,112,569
457,900
199,096
455,573
199,096
654,669
22View entire presentation