Evercore Investment Banking Pitch Book
McMoRan Situation Analysis
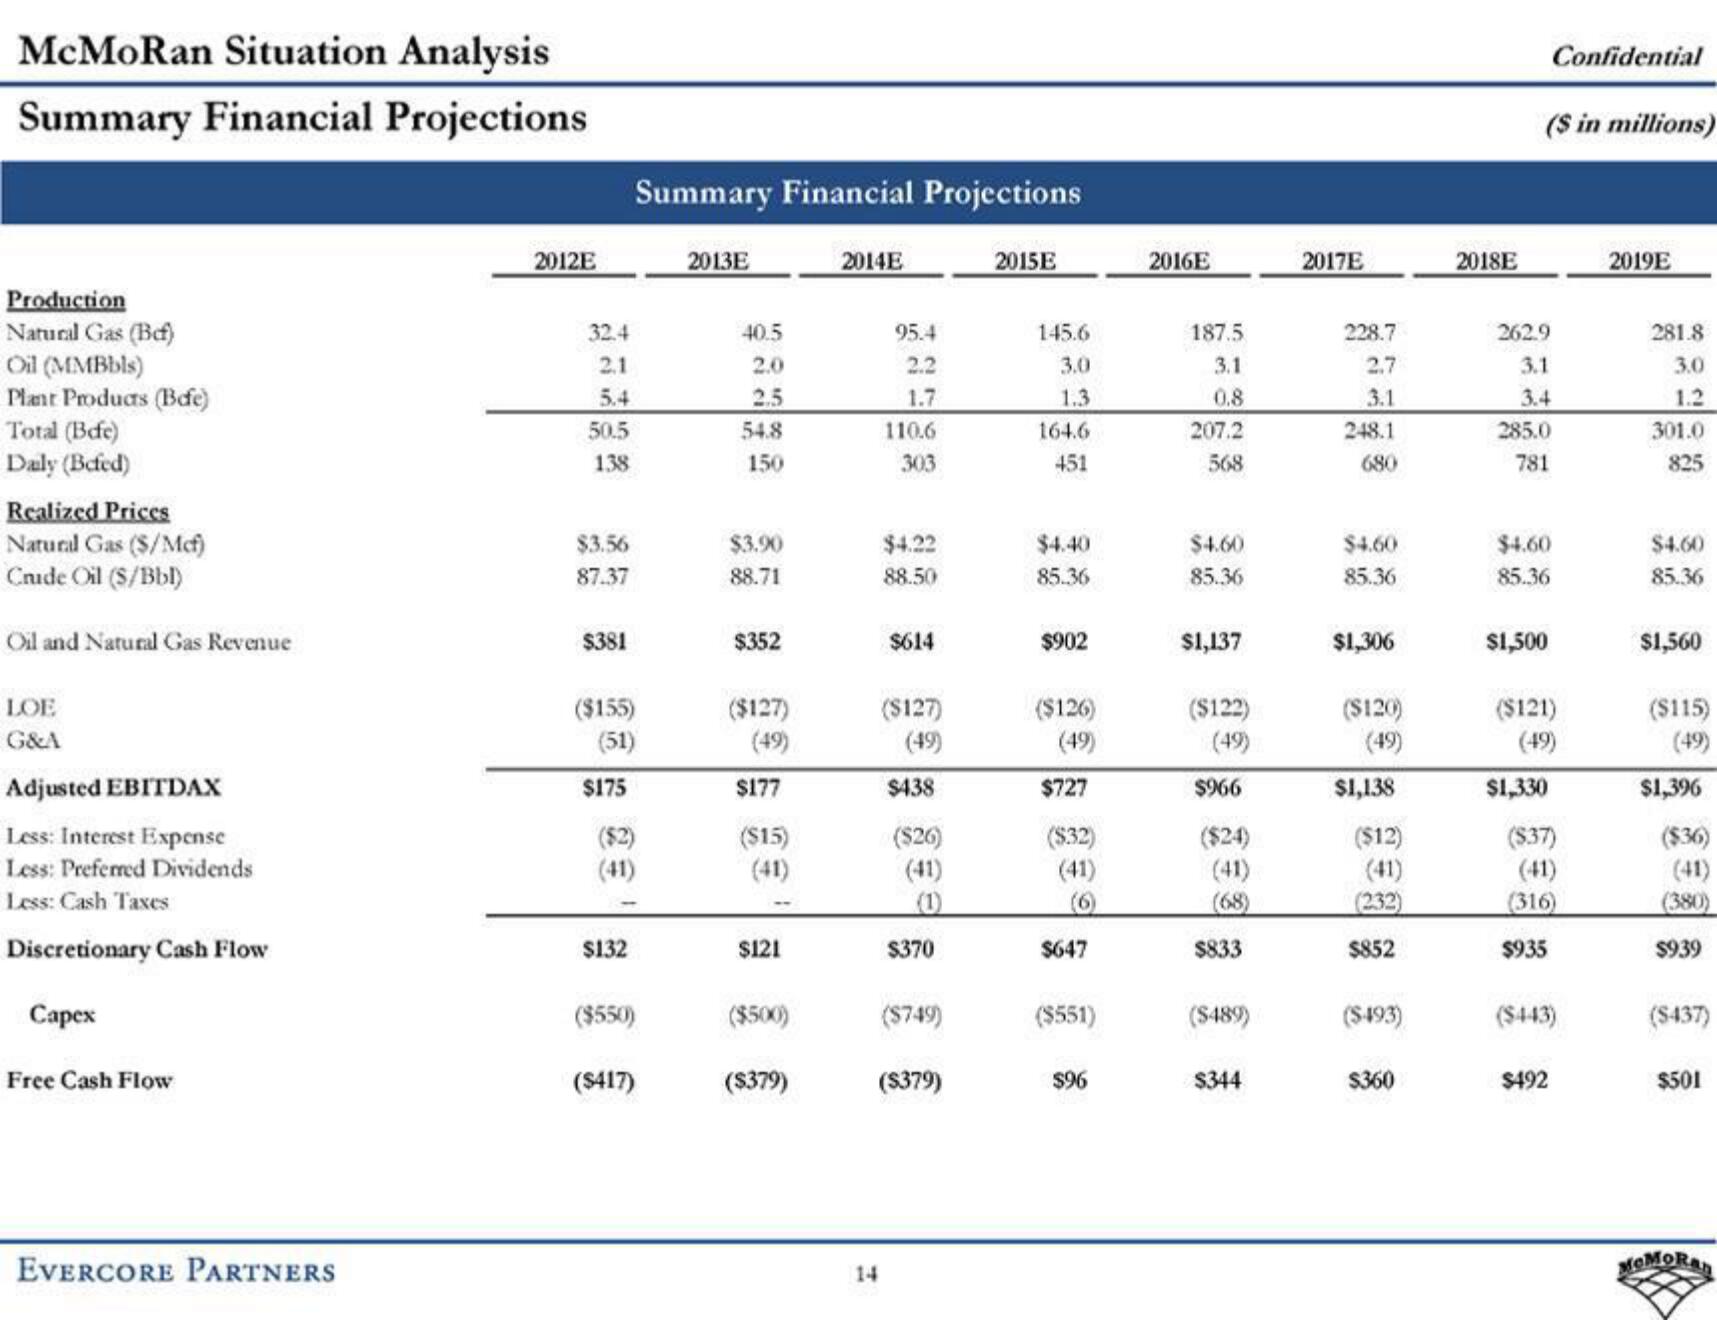
Summary Financial Projections
Production
Natural Gas (Bef)
Oil (MMBbls)
Plant Products (Befe)
Total (Befe)
Daily (Befed)
Realized Prices
Natural Gas ($/Mcf)
Crude Oil ($/Bbl)
Oil and Natural Gas Revenue
LOE
G&A
Adjusted EBITDAX
Less: Interest Expense
Less: Preferred Dividends
Less: Cash Taxes
Discretionary Cash Flow
Capex
Free Cash Flow
EVERCORE PARTNERS
2012E
32.4
2.1
5.4
50.5
138
$3.56
87.37
$381
($155)
(51)
$175
Summary Financial Projections
($2)
$132
($550)
($417)
2013E
40.5
2.0
2.5
54.8
$3.90
88.71
$352
($127)
(49)
$177
($15)
(41)
$121
($500)
($379)
2014E
95.4
2.2
1.7
110.6
14
$4.22
88.50
$614
($127)
(49)
$438
($26)
(41)
$370
($749)
($379)
2015E
145.6
3.0
1.3
164.6
$4.40
85.36
$902
($126)
(49)
$727
($32)
(41)
(6)
$647
($551)
$96
2016E
187.5
3.1
0.8
207.2
$4.60
85.36
$1,137
($122)
(49)
$966
($24)
(41)
(68)
$833
($489)
$344
2017E
228.7
2.7
3.1
248.1
680
$4.60
85.36
$1,306
($120)
(49)
$1,138
($12)
(41)
(232)
$852
($493)
$360
2018E
($ in millions)
262.9
3.1
3.4
Confidential
285.0
781
$4.60
85.36
$1,500
($121)
(49)
$1,330
($37)
(41)
(316)
$935
($443)
$492
2019E
281.8
3.0
1.2
301.0
825
$4.60
85.36
$1,560
($115)
(49)
$1,396
($36)
(41)
(380)
$939
($437)
$501
MOMORANView entire presentation