DraftKings Investor Day Presentation Deck
Billions of Dollars
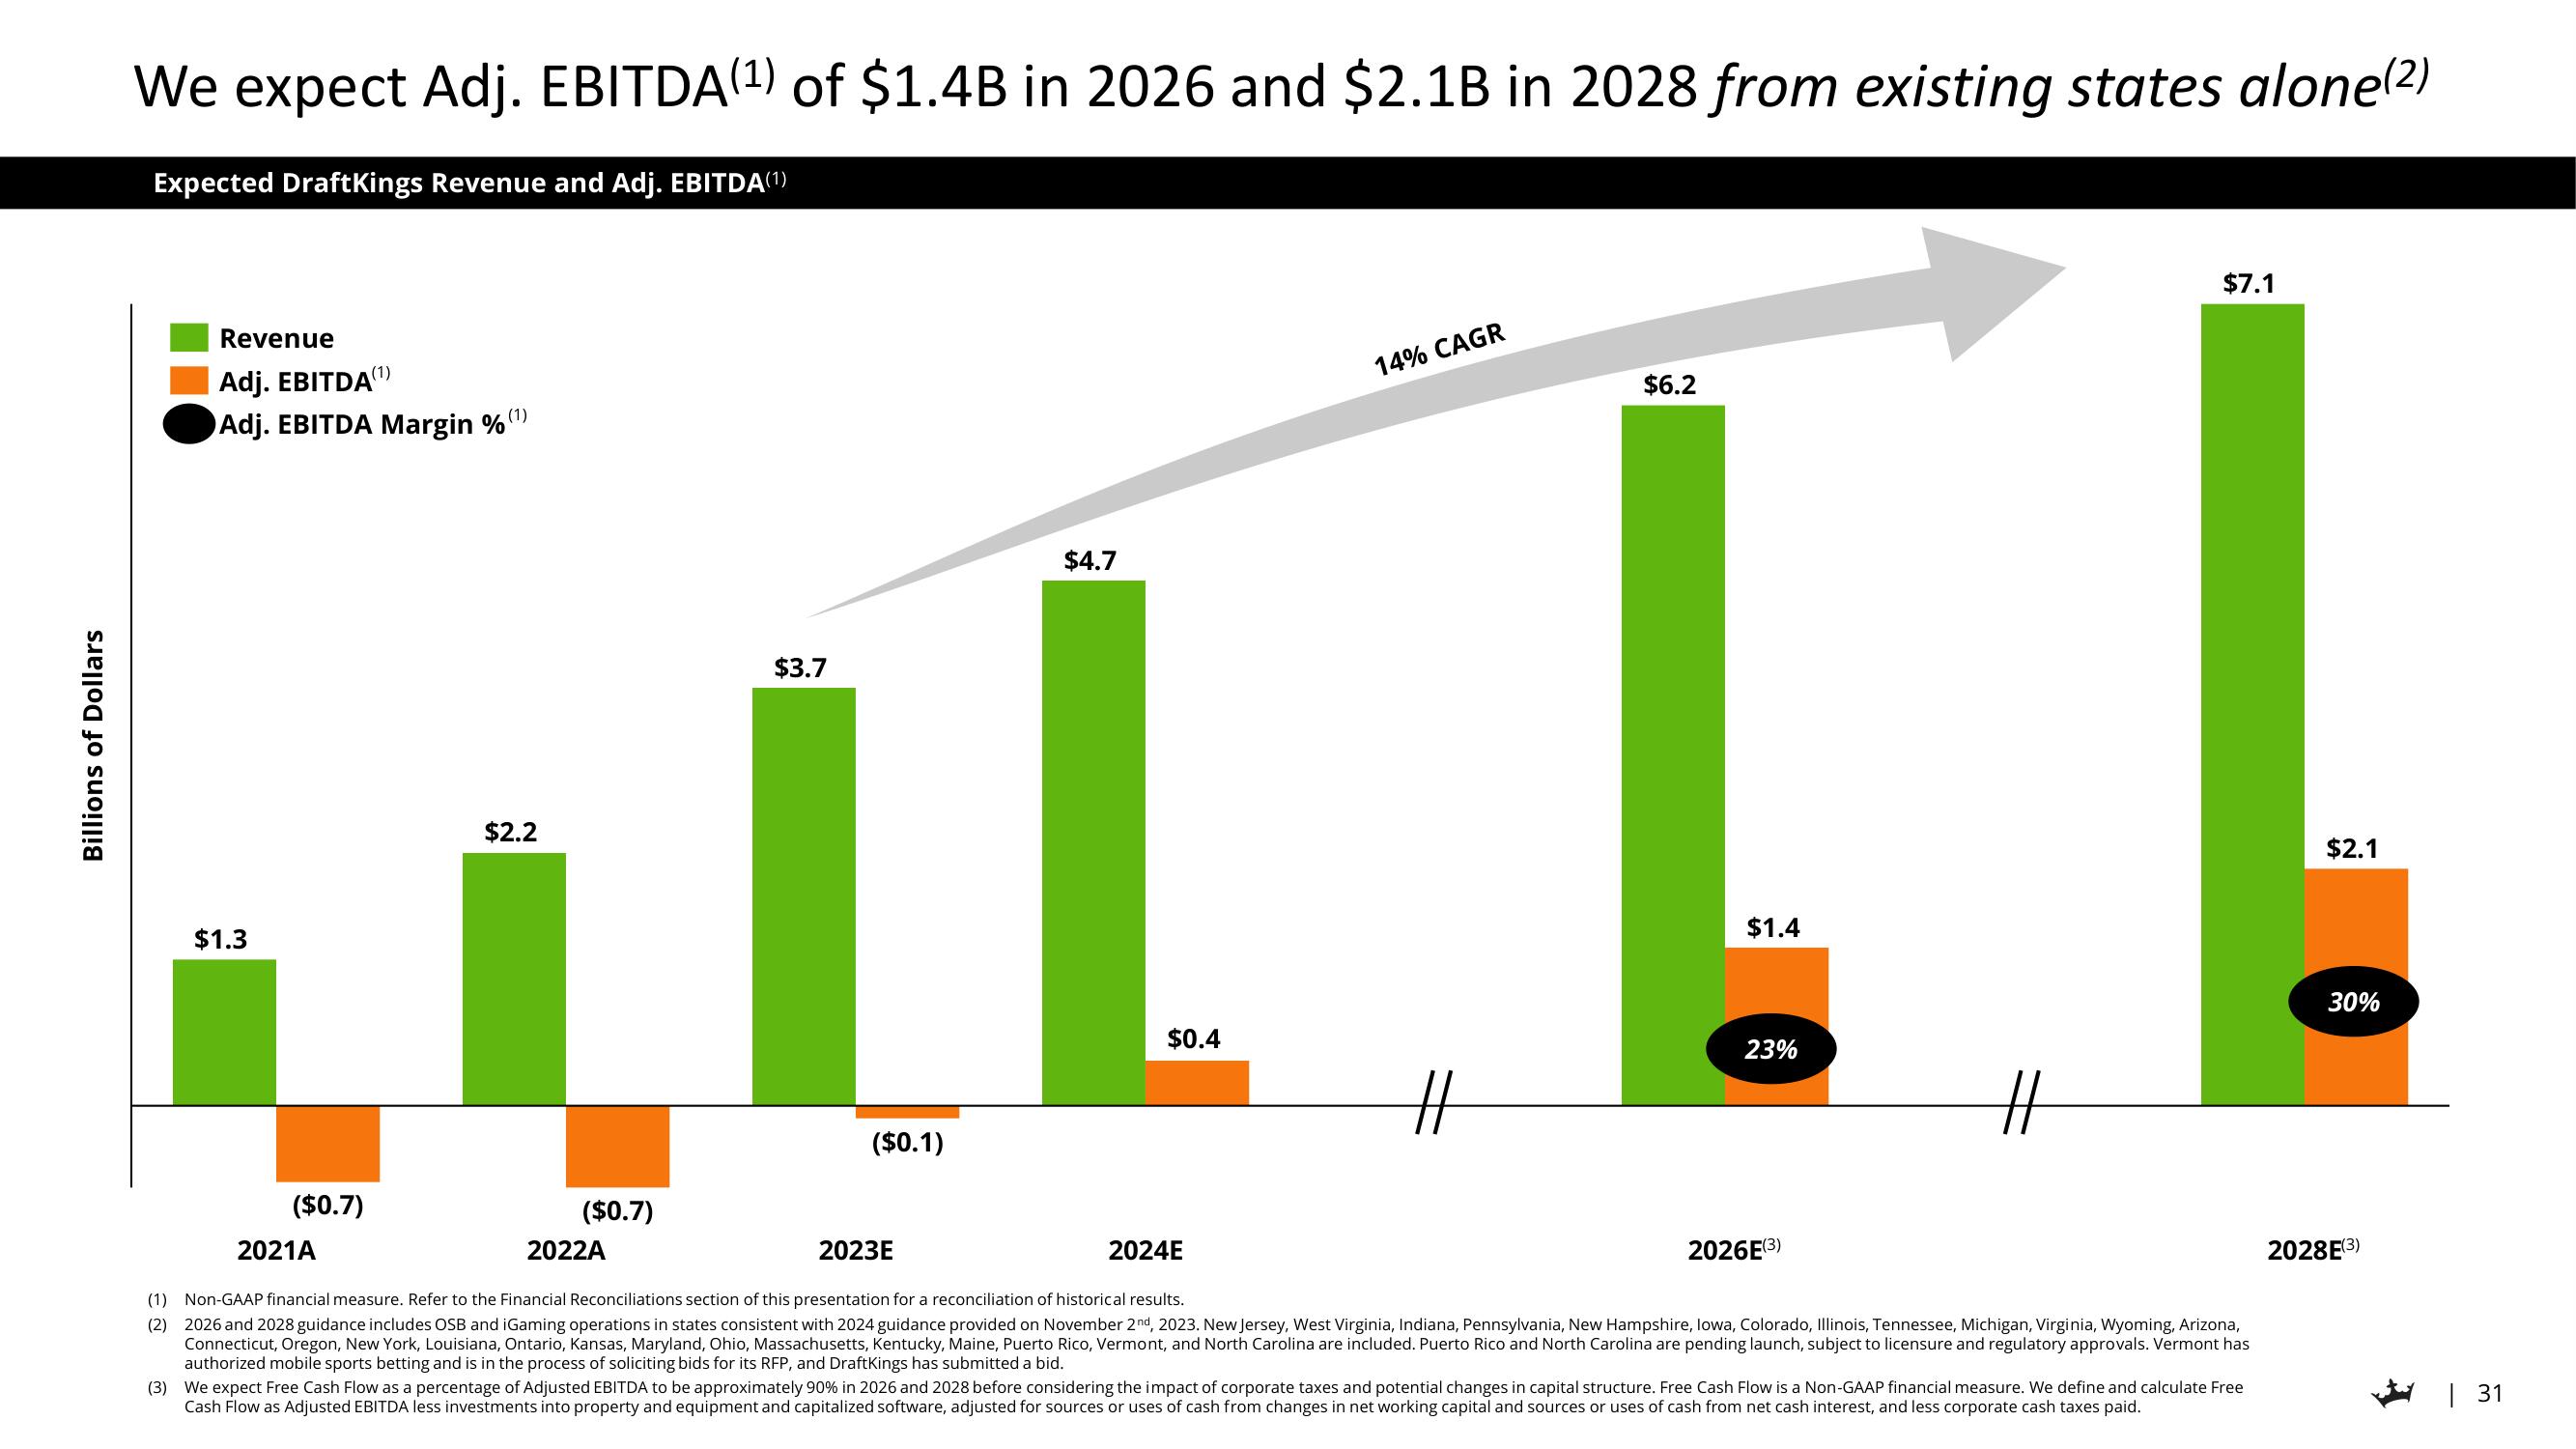
We expect Adj. EBITDA(¹) of $1.4B in 2026 and $2.1B in 2028 from existing states alone(²)
Expected DraftKings Revenue and Adj. EBITDA(1)
Revenue
Adj. EBITDA
(1)
Adj. EBITDA Margin %
$1.3
($0.7)
2021A
(1)
$2.2
($0.7)
2022A
$3.7
($0.1)
2023E
$4.7
$0.4
2024E
14% CAGR
#
$6.2
$1.4
23%
2026E(3)
#
$7.1
(1) Non-GAAP financial measure. Refer to the Financial Reconciliations section of this presentation for a reconciliation of historical results.
(2) 2026 and 2028 guidance includes OSB and iGaming operations in states consistent with 2024 guidance provided on November 2nd, 2023. New Jersey, West Virginia, Indiana, Pennsylvania, New Hampshire, Iowa, Colorado, Illinois, Tennessee, Michigan, Virginia, Wyoming, Arizona,
Connecticut, Oregon, New York, Louisiana, Ontario, Kansas, Maryland, Ohio, Massachusetts, Kentucky, Maine, Puerto Rico, Vermont, and North Carolina are included. Puerto Rico and North Carolina are pending launch, subject to licensure and regulatory approvals. Vermont has
authorized mobile sports betting and is in the process of soliciting bids for its RFP, and DraftKings has submitted a bid.
(3) We expect Free Cash Flow as a percentage of Adjusted EBITDA to be approximately 90% in 2026 and 2028 before considering the impact of corporate taxes and potential changes in capital structure. Free Cash Flow is a Non-GAAP financial measure. We define and calculate Free
Cash Flow as Adjusted EBITDA less investments into property and equipment and capitalized software, adjusted for sources or uses of cash from changes in net working capital and sources or uses of cash from net cash interest, and less corporate cash taxes paid.
$2.1
30%
2028E(3)
| 31View entire presentation