Tudor, Pickering, Holt & Co Investment Banking
EXITDA
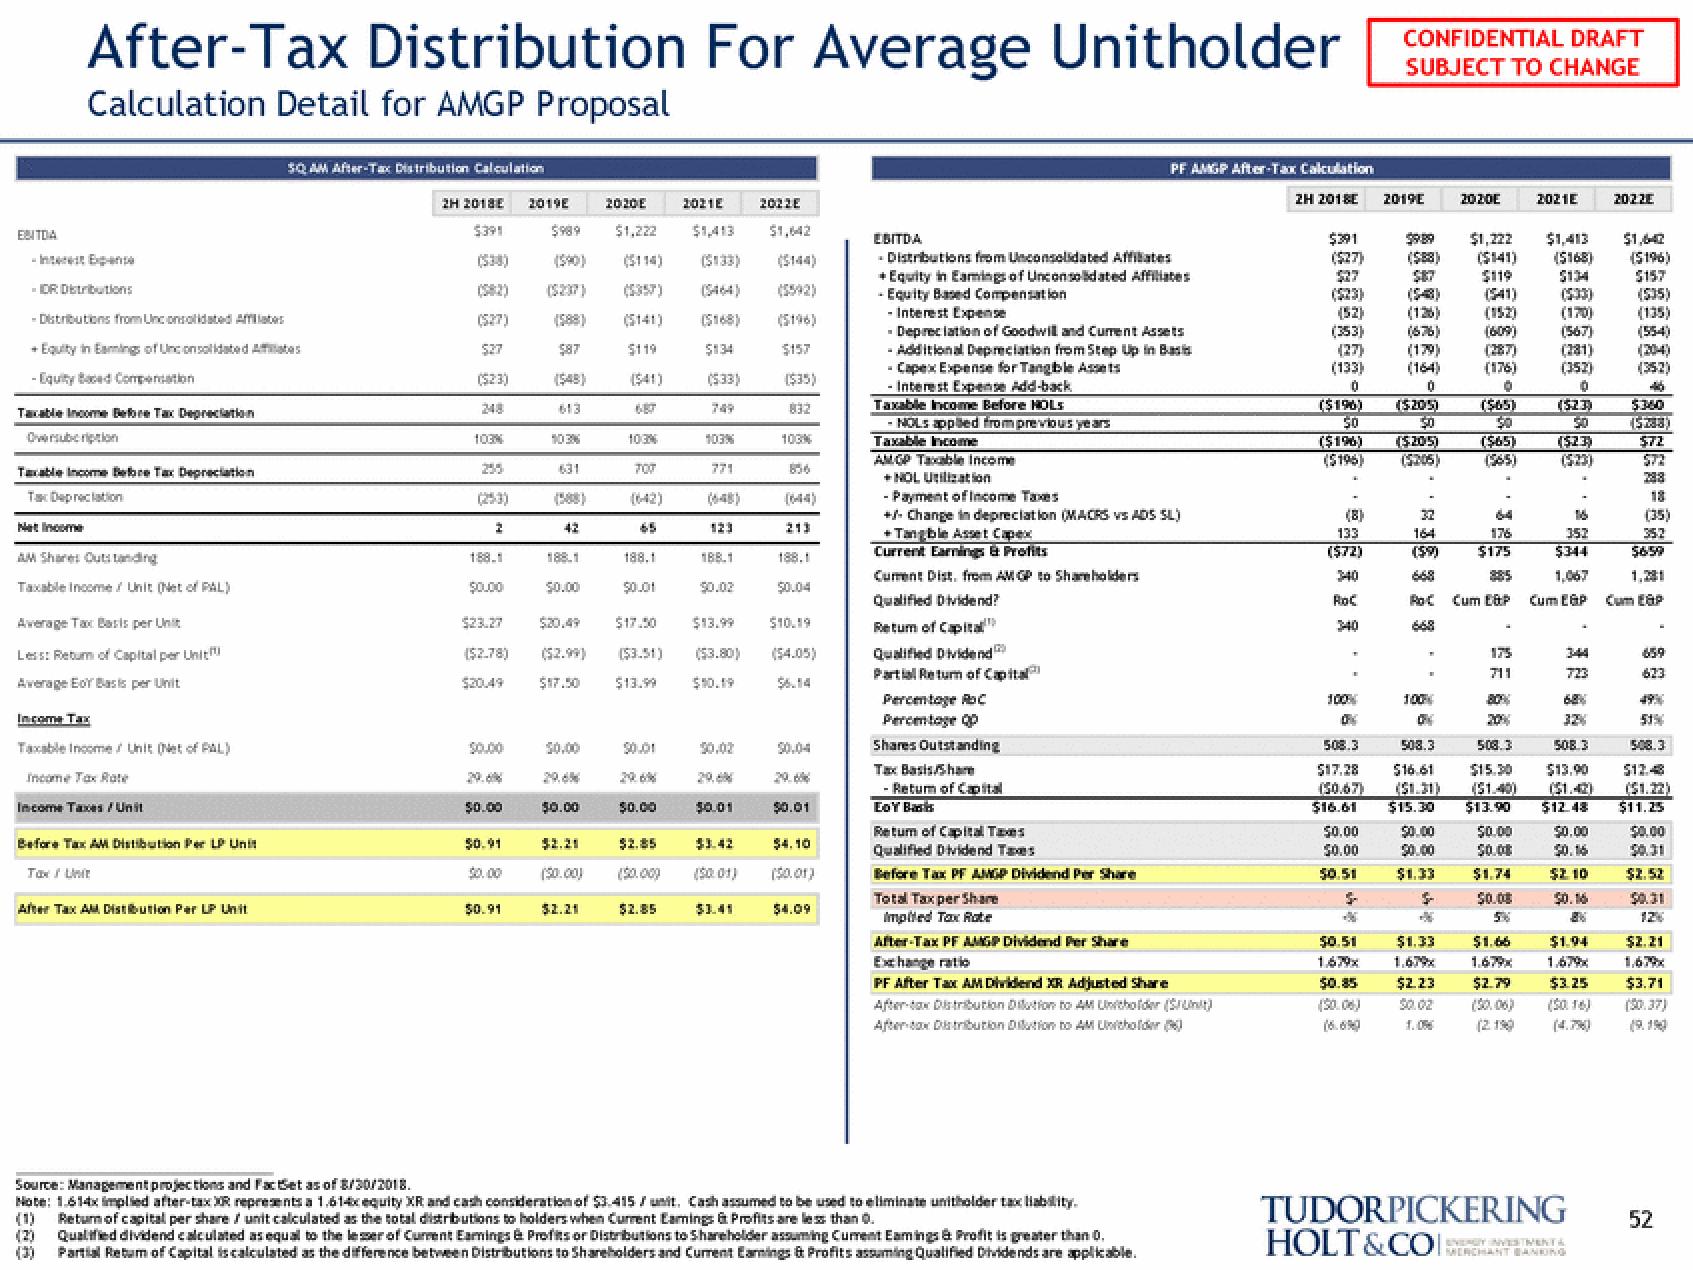
After-Tax Distribution For Average Unitholder
Calculation Detail for AMGP Proposal
Interest Expense
-DR Distributions
- Distributions from Unconsolidated Affilates
+ Equity in Earnings of Unconsolidated Affinates
-Equity Bed Compensation
Taxable Income Before Tax Depreciation
Oversubcription
Taxable Income Before Tax Depreciation
Tax Depreciation
Net Income
AM Share Outstanding
Taxable income / Unit (Net of PAL)
Average Tax Basis per Unit
Less: Return of Capital per Unit
Average EoY Basis per Unit
Income Tax
Taxable income / Unit (Net of PAL)
Income Tax Rate
Income Taxes / Unit
Before Tax AM Distibution Per LP Unit
Tax / Unit
SQ AM After-Tax Distribution Calculation
After Tax AM Distribution Per LP Unit
2H 2018E 2019E
5391
$989
($27)
527
($23)
248
103%
255
(253)
2
188.1
$0.00
($2.78)
$20.49
$0.00
50.00
$0.91
$0.91
(588)
613
103%
631
42
188.1
$0.00
$20.49
($2.99)
$17.50
50.00
29.6%
50.00
$2.21
$2.21
2020E
$1,222
$119
($41)
103%
65
188.1
$17.50
($3.51)
$13.99
$0.01
50.00
$2.85
(50.00)
$2.85
2021E
$134
(533)
103%
771
123
188.1
50.02
$13.99
($3.80)
50.02
29.4
$0.01
$3.42
2022E
($35)
832
100%
213
$0.04
$10.19
($4.05)
$0.01
$4.10
($0.01)
EBITDA
- Distributions from Unconsolidated Affiliates
+ Equity in Earings of Unconsolidated Affiliates
-Equity Based Compensation
- Interest Expense
- Depreciation of Goodwill and Current Assets
- Additional Depreciation from Step Up in Basis
-Capex Expense for Tangible Assets
-Interest Expense Add-back
Taxable income Before HOLS
- NOLS applied from previous years
Taxable Income
AMGP Taxable income
+NOL Utilization
- Payment of Income Taxes
+/- Change in depreciation (MACRS vs ADS SL)
+Tangible Asset Capex
Current Earnings & Profits
Current Dist, from AM GP to Shareholders
Qualified Dividend?
Retum of Capital
Qualified Dividend
Partial Return of Capital
Percentage Roc
Percentage op
Shares Outstanding
Tax Basis Sham
Retum of Capital
EoY Basis
Retum of Capital Taxes
Qualified Dividend Taxes
Before Tax PF AMGP Dividend Per Share
PF AMGP After-Tax Calculation
2H 2018E
Total Tax per Share
Impiled Tax Rate
After-Tax PF AMGP Dividend Per Share
PF After Tax AM Dividend XR Adjusted Share
After-tax Distribution Dilution to AM Unitholder (Sunit)
After-tax Distribution Dilution to AM Unitholder (
Source: Management projections and FactSet as of 8/30/2018.
Note: 1.614x implied after-tax XR represents a 1.614x equity XR and cash consideration of $3.415 / unit. Cash assumed to be used to eliminate unitholder tax liability.
Return of capital per share / unit calculated as the total distributions to holders when Current Eamings & Profits are less than 0.
(1)
Qualified dividend calculated as equal to the lesser of Current Eamings & Profits or Distributions to Shareholder assuming Current Eamings & Profit is greater than 0.
Partial Return of Capital is calculated as the difference between Distributions to Shareholders and Current Earnings & Profits assuming Qualified Dividends are applicable.
$391
($27)
$27
(52)
(353)
(27)
(133)
0
($196)
50
($196)
(5196)
(8)
133
(572)
340
Roc
340
CONFIDENTIAL DRAFT
SUBJECT TO CHANGE
50.51
1.679x
$0.85
2019E
($88)
$87
(126)
$9.89 $1,222 $1,413 $1,642
($141) ($168)
$119
$134
(179)
0
(5205)
$0
($205)
($205)
37
164
RoC
668
100%
OFC
ON
508.3 508.3
$17.28 $16.61
(50.67)
$16.61
$0.00
50.00
50.51
S-
2020E
$1.33
1,67%
$2.23
50.02
($41)
(152)
(176)
0
($65)
$0
($65)
(565)
64
176
$175
Cum E&P
175
711
80%
$15.30 $13.90
$0.00 $0.00
90.00
$0.00
$1.33
$1.74
$
$0.00
$1.66
2021E
$2.79
(2190)
(567)
(281)
(352)
0
(523)
50
(523)
16
352
$344
508.3
508.3
$15.30 $13.90
Cum E&P
723
68%
32%
$12.43
$0.00
$0.16
$2.10
50.16
EN
$1.94
1,67%
$3.25
2022E
TUDORPICKERING
HOLT&COCHANT BANKING
($196)
$157
(135)
(554)
(204)
46
$360
($288)
$72
572
18
(35)
35.2
$659
1.281
Cum EGP
659
623
49%
51%
508.3
$12.48
$11.25
$0.00
$0.31
12%
$2.21
1,67%
$3.71
52View entire presentation