J.P.Morgan 4Q23 Earnings Results
JPMORGAN CHASE & CO.
CORPORATE & INVESTMENT BANK
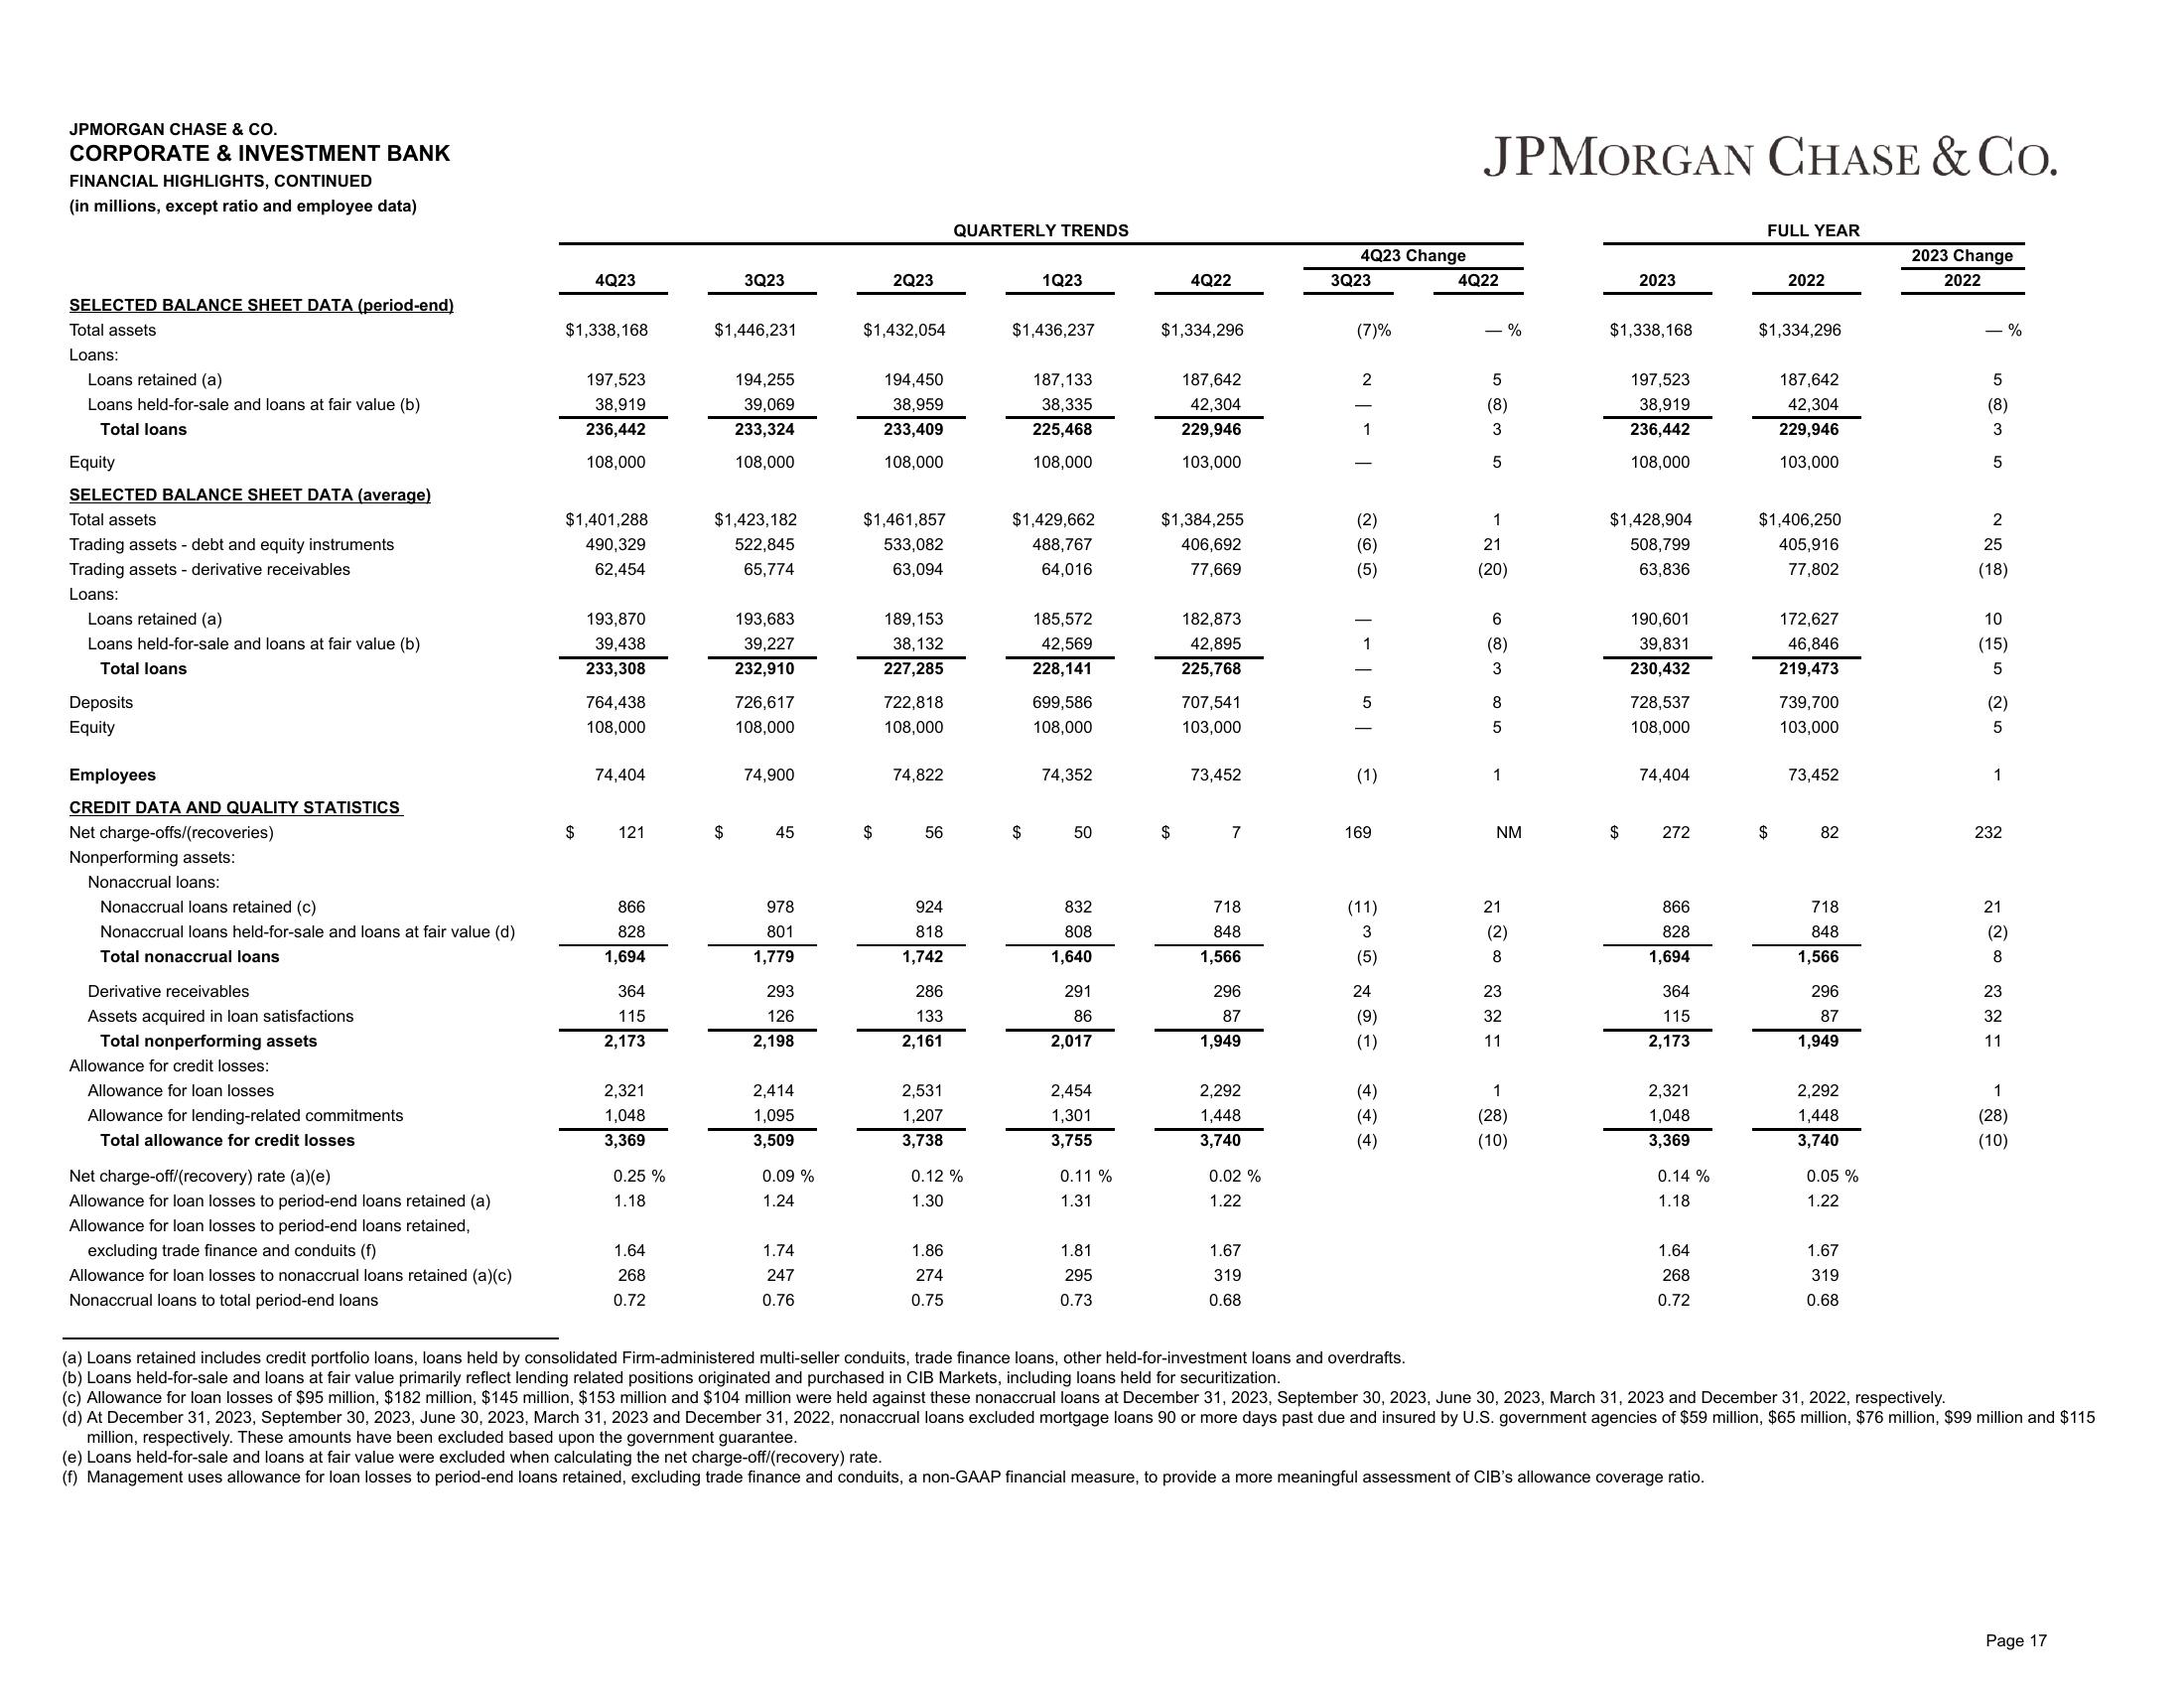
FINANCIAL HIGHLIGHTS, CONTINUED
(in millions, except ratio and employee data)
SELECTED BALANCE SHEET DATA (period-end)
Total assets
Loans:
Loans retained (a)
Loans held-for-sale and loans at fair value (b)
Total loans
Equity
SELECTED BALANCE SHEET DATA (average)
Total assets
Trading assets - debt and equity instruments
Trading assets - derivative receivables
Loans:
Loans retained (a)
Loans held-for-sale and loans at fair value (b)
Total loans
Deposits
Equity
Employees
CREDIT DATA AND QUALITY STATISTICS
Net charge-offs/(recoveries)
Nonperforming assets:
Nonaccrual loans:
Nonaccrual loans retained (c)
Nonaccrual loans held-for-sale and loans at fair value (d)
Total nonaccrual loans
Derivative receivables
Assets acquired in loan satisfactions
Total nonperforming assets
Allowance for credit losses:
Allowance for loan losses
Allowance for lending-related commitments
Total allowance for credit losses
Net charge-off/(recovery) rate (a)(e)
Allowance for loan losses to period-end loans retained (a)
Allowance for loan losses to period-end loans retained,
excluding trade finance and conduits (f)
Allowance for loan losses to nonaccrual loans retained (a)(c)
Nonaccrual loans to total period-end loans
4Q23
$1,338,168
$
197,523
38,919
236,442
108,000
$1,401,288
490,329
62,454
193,870
39,438
233,308
764,438
108,000
74,404
121
866
828
1,694
364
115
2,173
2,321
1,048
3,369
0.25%
1.18
1.64
268
0.72
3Q23
$1,446,231
$
194,255
39,069
233,324
108,000
$1,423,182
522,845
65,774
193,683
39,227
232,910
726,617
108,000
74,900
45
978
801
1,779
293
126
2,198
2,414
1,095
3,509
0.09 %
1.24
1.74
247
0.76
2Q23
$1,432,054
$
194,450
38,959
233,409
108,000
$1,461,857
533,082
63,094
189,153
38,132
227,285
722,818
108,000
74,822
56
924
818
1,742
286
133
2,161
2,531
1,207
3,738
QUARTERLY TRENDS
0.12 %
1.30
1.86
274
0.75
1Q23
$1,436,237
$
187,133
38,335
225,468
108,000
$1,429,662
488,767
64,016
185,572
42,569
228,141
699,586
108,000
74,352
50
832
808
1,640
291
86
2,017
2,454
1,301
3,755
0.11%
1.31
1.81
295
0.73
4Q22
$1,334,296
$
187,642
42,304
229,946
103,000
$1,384,255
406,692
77,669
182,873
42,895
225,768
707,541
103,000
73,452
7
718
848
1,566
296
87
1,949
2,292
1,448
3,740
0.02%
1.22
1.67
319
0.68
4Q23 Change
3Q23
(7)%
2
| | |
(2)
(6)
(5)
| G | - |
(1)
169
(11)
3
(5)
24
(9)
(1)
(4)
(4)
(4)
JPMORGAN CHASE & CO.
4Q22
5
(8)
3
5
1
21
(20)
6
(8)
3
8
5
%
1
NM
21
(2)
8
23
32
11
1
(28)
(10)
2023
$1,338,168
$
197,523
38,919
236,442
108,000
$1,428,904
508,799
63,836
190,601
39,831
230,432
728,537
108,000
74,404
272
866
828
1,694
364
115
2,173
2,321
1,048
3,369
0.14%
1.18
1.64
268
0.72
FULL YEAR
2022
$1,334,296
$
187,642
42,304
229,946
103,000
$1,406,250
405,916
77,802
172,627
46,846
219,473
739,700
103,000
73,452
82
718
848
1,566
296
87
1,949
2,292
1,448
3,740
0.05%
1.22
1.67
319
0.68
2023 Change
2022
- %
5
(8)
3
5
2
25
(18)
10
(15)
5
(2)
5
1
232
21
(2)
8
23
32
11
1
(28)
(10)
(a) Loans retained includes credit portfolio loans, loans held by consolidated Firm-administered multi-seller conduits, trade finance loans, other held-for-investment loans and overdrafts.
(b) Loans held-for-sale and loans at fair value primarily reflect lending related positions originated and purchased in CIB Markets, including loans held for securitization.
(c) Allowance for loan losses of $95 million, $182 million, $145 million, $153 million and $104 million were held against these nonaccrual loans at December 31, 2023, September 30, 2023, June 30, 2023, March 31, 2023 and December 31, 2022, respectively.
(d) At December 31, 2023, September 30, 2023, June 30, 2023, March 31, 2023 and December 31, 2022, nonaccrual loans excluded mortgage loans 90 or more days past due and insured by U.S. government agencies of $59 million, $65 million, $76 million, $99 million and $115
million, respectively. These amounts have been excluded based upon the government guarantee.
(e) Loans held-for-sale and loans at fair value were excluded when calculating the net charge-off/(recovery) rate.
(f) Management uses allowance for loan losses to period-end loans retained, excluding trade finance and conduits, a non-GAAP financial measure, to provide a more meaningful assessment of CIB's allowance coverage ratio.
Page 17View entire presentation