Baird Investment Banking Pitch Book
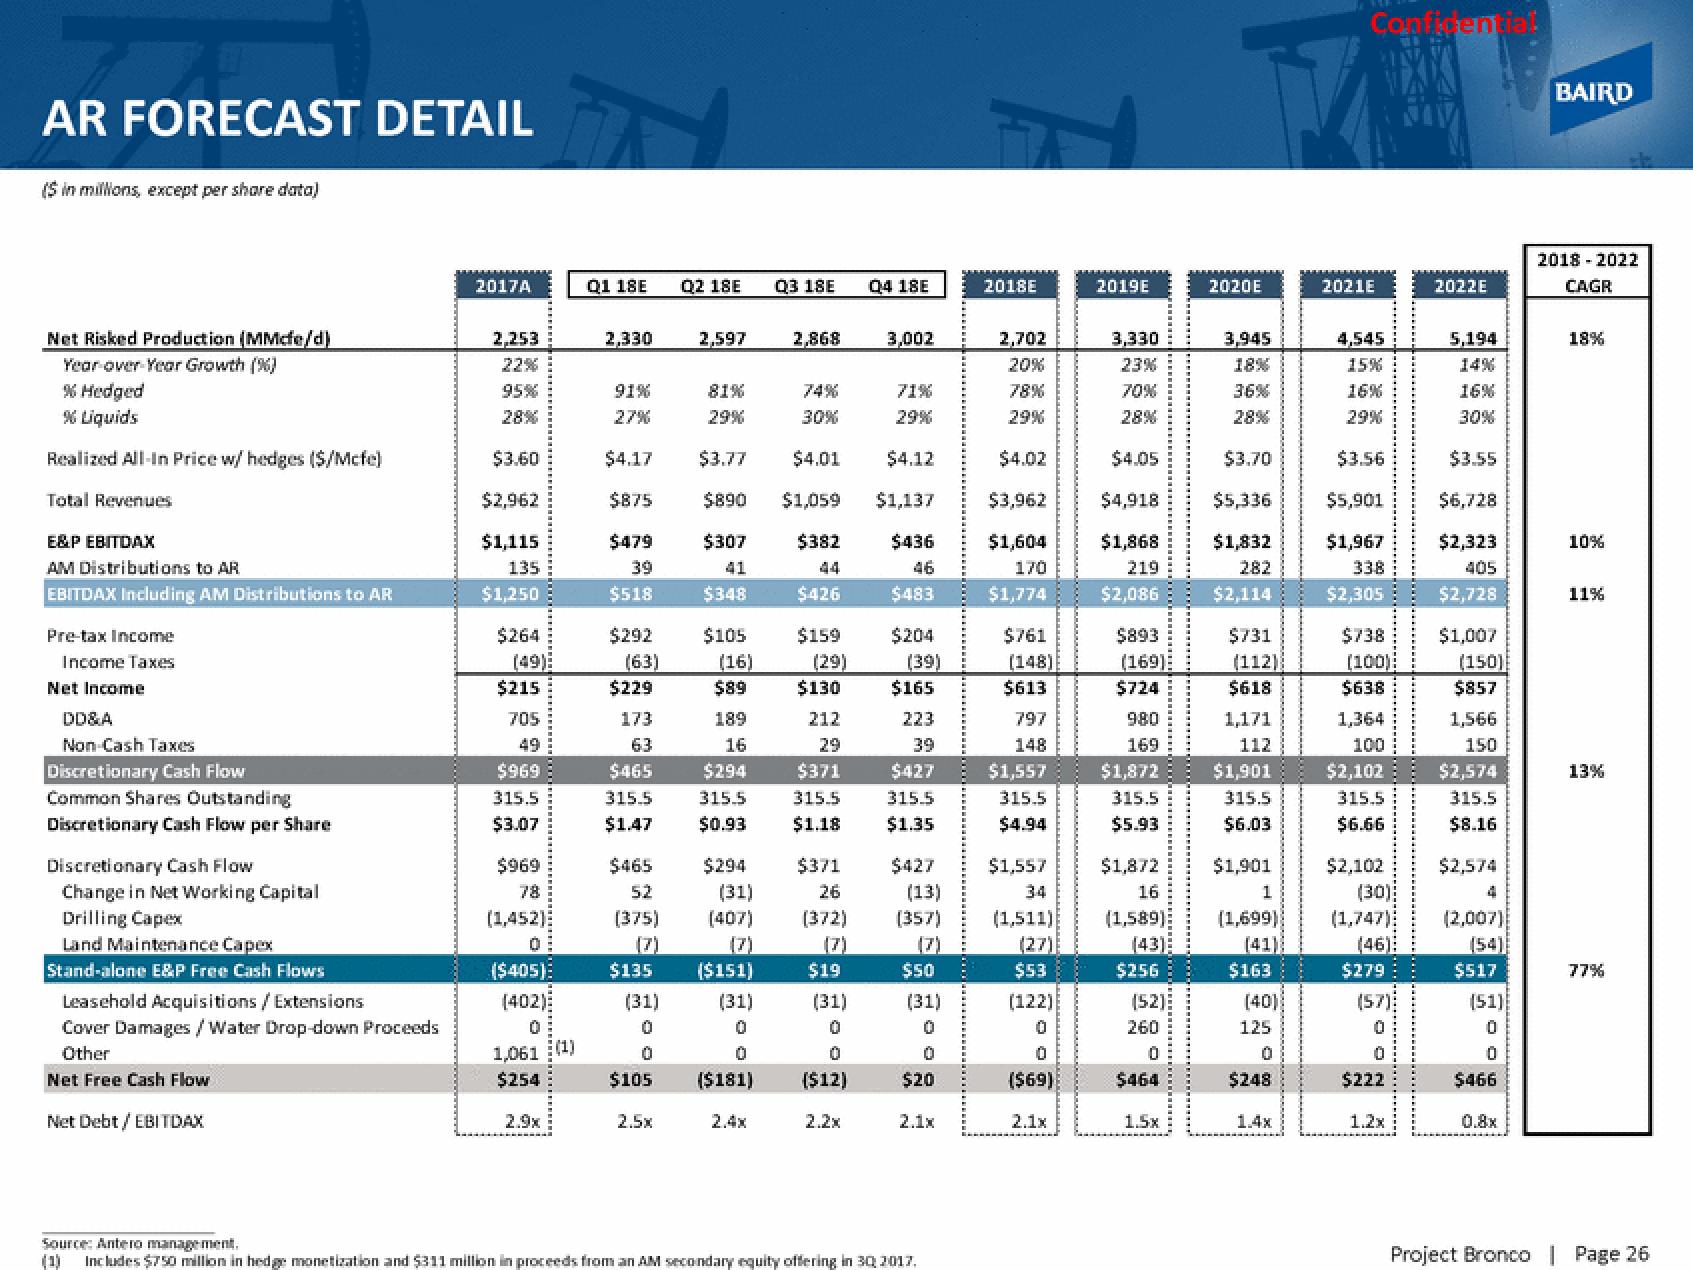
AR FORECAST DETAIL
($ in millions, except per share data)
Net Risked Production (MMcfe/d)
Year over Year Growth (%)
% Hedged
% Liquids
Realized All-In Price w/ hedges ($/Mcfe)
Total Revenues
E&P EBITDAX
AM Distributions to AR
EBITDAX Including AM Distributions to AR
Pre-tax Income
Income Taxes
Net Income
DD&A
Non Cash Taxes
Discretionary Cash Flow
Common Shares Outstanding
Discretionary Cash Flow per Share
Discretionary Cash Flow
Change in Net Working Capital
Drilling Capex
Land Maintenance Capex
Stand-alone E&P Free Cash Flows
Leasehold Acquisitions / Extensions
Cover Damages/Water Drop-down Proceeds
Other
Net Free Cash Flow
Net Debt / EBITDAX
2017A
2,253
22%
95%
28%
$3.60
$2,962
$1,115
135
$1,250
$264
(49)
$215
705
$969
315.5
$3.07
$969
78
(1,452)
($405):
(402)
0
1,061
$254
2.9x
(1)
Q1 18E
2,330
91%
$4.17
$875
$479
39
$518
$292
(63)
$229
173
63
$465
315.5
$1.47
$465
52
(375)
(7)
$135
(31)
0
0
$105
2.5x
Q2 18E
2,597
$105
(16)
$89
189
16
$294
315.5
$0.93
81%
71%
29%
30%
29%
$3.77
$4.01
$4.12
$890 $1,059 $1,137
$307
$382
$436
41
$348
$294
(31)
(407)
03 18E
($151)
(31)
0
0
($181)
2,868
$426
$159
(29)
$130
212
29
$371
315.5
$1.18
$371
26
(372)
$19
Q4 18E
(31)
0
0
($12)
2.2x
3,002
$483
$204
(39)
$165
223
39
$427
315.5
$1.35
$427
(13)
(357)
$50
(31)
0
0
$20
2.1x
Source: Antero management.
(1)
Includes $750 million in hedge monetization and $311 million in proceeds from an AM secondary equity offering in 30 2017.
2018E
2,702
20%
78%
29%
$4.02
$3,962
$1,604
170
$1,774
$761
(148)
$613
797
148
$1,557
315.5
$4.94
$1,557
34
(1,511)
(27)
$53
(122)
0
0
($69)
2.1x
2019E
3,330
23%
70%
28%
$4.05
$4,918
$1,868
219
$2,086
$893
(169)
$724
980
169
$1,872
315.5
$5.93
$1,872
16
(1,589)
(43)
$256
(52)
260
0
$464
1.5x
2020E
3,945
18%
36%
28%
$3.70
$5,336
$1,832
282
$2,114
$731
(112)
$618
1,171
112
$1,901
315.5
$6.03
$1,901
1
(1,699)
(41)
$163
(40)
125
0
$248
1.4x
Confidential
2021E
4,545
15%
16%
29%
$3.56
$5,901
$1,967
338
$2,305
$738
(100):
$638
1,364
100
$2,102
315.5
$6.66
$2,102
(30)
(1,747)
(46):
$279:
(57)
0
0
$222
1.2x
2022E
5,194
16%
30%
$3.55
$6,728
$2,323
405
$2,728
$1,007
(150)
$857
1,566
150
$2,574
315.5
$8.16
$2,574
4
(2,007)
$517
(51)
0
0
$466
0.8x
BAIRD
2018-2022
CAGR
18%
10%
11%
13%
77%
Project Bronco | Page 26View entire presentation